
OUR VISION
The world's finest educators supporting science, technology, engineering, and math (STEM) learning for pre-kindergarten to post-graduate students using real-world applications from satellites and satellite data.
OUR MISSION
To enhance the education environment to excite students about science, technology, engineering, and math through space-based technology -- satellites and satellite data.

Ronald Reagan

If ye love wealth better than liberty, the tranquility of servitude than the animated contest of freedom -- go home from us in peace. We ask not your counsels or arms. Crouch down and lick the hands which feed you. May your chains sit lightly upon you, and may posterity forget that you were our countrymen!
Samuel Adams

TABLE OF CONTENTS
Click a RED link to view article
ASSOCIATION NEWS
PRESIDENT'S CORNER
JOHN'S JOURNEY
STEVE'S SPACE
A LOOK BACK
SATELLITES
ACCESS
ANALYZE
APPLY
IN THE NEWS
FOR TEACHERS
MORE LESSONS FROM THE SKY

September 1, 2026
It is September, and the last day of summer officially will be the 21st, just before the fall equinox. The new school year has started in many U.S. locales. The Satellite Educators Association's commitment to education has not wavered.
The top story this month is the SmallSat Education Conference scheduled for November at Kennedy Space Center in Florida. Learn all about small satellites like CubeSats, how to build them with pre-college students and launch them on high-altitude balloons. The engineering design of those small satellites must include consideration for why they are built -- what sensors will the small sats carry and how will the data collected from those sensors be used? Register NOW to attend. The call for papers ends Sept. 15.
The Fall 2026 issue of the SEA Newsletter is full with information and ideas. It has a lunar eclipse; satellites; remote sensing data accessed, analyzed, applied in the real world; information both basic and technical; notes for teachers and a lesson plan suggestion; access to feedback to SEA as well as a safe discussion board for your comments, questions, and ideas you would like to share. The Newsletter offers its regular columnists, updates from NOAA and NASA, and SEA news and updates.
Enjoy!
--Editor

[ Back to Top ]

SmallSat Education Conference, Nov. 7-8, 2026, Kennedy Space Center
The 2026 SmallSat Education Conference will take place at the AMF Center for Space Education in the Kennedy Space Center-Visitor Center in Florida, November 7-8, 2026. "The SmallSat Education Conference provides hands-on training for educators and students, networking opportunities with industry experts, and insights from exhibitors and vendors. Managed by Aerospace and Innovation Academy, The Wolfpack CubeSat Development Team, and BLUECUBE Aerospace, the event engages attendees with CubeSats, ThinSats, and High-Altitude Balloon programs, offering authentic experiences to help bring space education to the classroom." (www.smallsateducation.org)
You are invited to meet Stanley O. Kennedy, Jr. and Carol Craig, this year's SmallSat Education Conference keynote speakers, at www.smallsateducation.org. Mr. Kennedy is a lifelong aerospace innovator who has contributed to the development of heavy-lift launch vehicles, upper stages, spacecraft, and ground systems for both government and commercial customers worldwide. Ms Craig is founder and CEO of both Sidus Space, Inc. and Craig Technologies providing engineering and technology support for commercial and government customers. She is a former U.S. Navy Flight Officer. Both eminently qualified speakers will bring a wealth of information to the educational community at this conference.
The 2026 theme is "Skills that Launch: Workforce Readiness and SmallSats." The conference will feature four dynamic tracks although innovative experiences and ideas beyond these themes are welcome. Abstracts for proposed presentations are due September 15, 2026. Abstracts can be submitted online at www.smallsateducation.org.
Conference registration is open now! Find your registration category at www.smallsateducation.org.
The program of presentations will be posted mid-October.
Goddard 100 Student Contests...
"The SmallSat Education Conference and the National Space Society (NSS) have joined forces to honor the legacy of Robert Goddard, the father of modern rocketry. In celebration of the 100th anniversary of that first modern rocket flight, students are invited to participate in a series of exciting contests that inspire creativity, innovation, and a passion for the future of space exploration." Click HERE for more info.
SmallSat Education Innovators Challenge...
"We are excited to announce an Educator Contest designed to inspire middle and high school educators to integrate authentic aerospace experiences into their curricula. In partnership with the SmallSat Education Conference, the Wolfpack CubeSat Development Team, and the American Institute of Aeronautics and Astronautics, we invite you to submit your innovative lesson plans, challenges, activities, or demonstrations that incorporate content related to incorporating high altitude balloons, ThinSats, CubeSats, and PocketQubes in the classrooms of middle and high school students. A total of $5,000 in prizes will be awarded to the challenge winners." Click HERE for more info.
If you remember the Satellites & Education Conference, this newer SmallSat Education Conference will surprise and impress with its usefulness. If you never heard of the Satellites & Education Conference, the SmallSat Education Conference is your best introduction to the important ways satellite technologies interface with K-16 education.
You can also watch the SEA Conferences page for more information as it becomes available.
[ Back to Top ]

Members of the Satellite Educators Association met on ZOOM for the Association's annual business meeting on August 19. With a quorum of Active members present, President Simon Cracknell opened the meeting at 2PM PDT from his home in England. Meeting members were logged in from China and from coast-to-coast in the United States.
Preliminary actions included approval of the agenda, review and approval of the Minutes of the 2025 meeting, and reports from the Treasurer, Membership Chair, Service Award Chair, and Web Manager. These reports are still available for inspection online. Visit https://SatEd.org and select Member Services.
Two items of importance were discussed:
Pros and cons of both items were considered at length, then each measure was approved by vote of the membership.
The Executive Committee was charged with meeting again in about 6 months to set the date for the next SEA Annual Meeting in August 2027.
A vote to adjourn the meeting passed a little after 4PM PDT.
Before the meeting was called to order, the ZOOM link was opened for sufficient time to allow attendees to catch up with old friends and colleagues and greet new faces -- an important time for renewal and connection.
Thanks to Dr. Paula Arvedson, SEA Secretary, for arranging the ZOOM set up and hosting the meeting.
[ Back to Top ]
The Satellite Educators Association has been around long enough to begin counting in its history extraordinary members who have passed away. These people, their accomplishments and contributions, will continue to live in our memories as long as we share their stories. You are invited to visit https://SatEd.org and Select About SEA, then select Shining Stars. If you knew any of these stars personally, you will honor them by continuing to share their stories with others.
SEA's Web site has a members-only section where Active SEA members can enjoy benefits such as the following:
All members are welcome in the Member Services area although some benefits are open only to Active members. To access, visit https://SatEd.org and select Member Services. The area is password protected. For best security, member's should reset their passwords at least once a year.
For members who have previously used Member Services, simply enter email address and password in the respective fields and the Log in button.
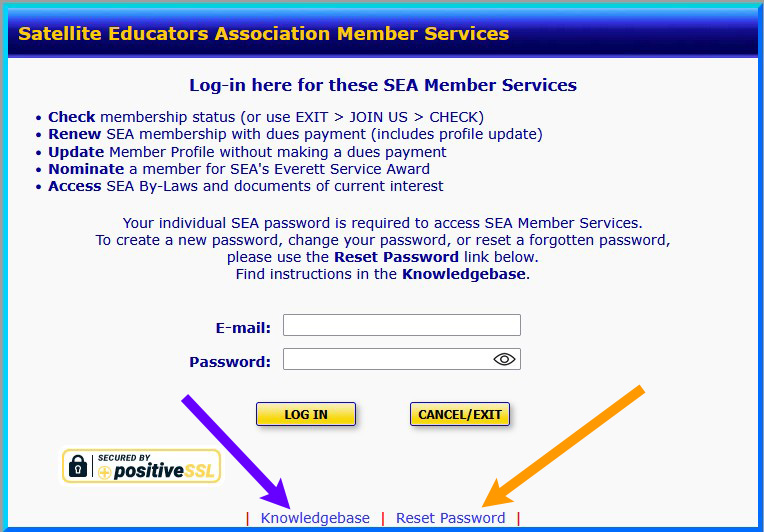
For members who have never used Member Services before (or your password needs to be updated), it is necessary to set a password before logging in. The Member Services log in screen has a Reset Password link at the bottom of the panel (orange arrow in the image). Just hover the cursor over the link and click once to start the process.
A new Knowedgebase has been added with full illustrated directions for navigating two-factor authentication to accomplish these tasks:
Two-factor authentication is a common tool for insuring your password is your own. A private code is sent to the member's email. The member must retrieve the code and copy it into the verification field in order to set a new password, change a password, or reset a forgotten password.
The Knowledgebase link is located next to the Reset Password link on the Member Services log in screen (purple arrow in the image above).
[ Back to Top ]



By Simon Cracknell, President, Satellite Educators Association; Classroom Teacher and Department Head, United Kingdom
When I read that the Artemis 3 mission, scheduled for next year, was not going to carry CubeSats like Artemis 1 and 2 had previously, it sparked some interest. The SEA has been supporting the Small Sat Conference in Florida for some time now and even since my last visit to California, John Moore has run sessions on them for M.Y. S.P.A.C.E. students and other visitors and has been keen to extol their broad applications. I have always been fascinated so my first impression was that it is a crazy move. Several countries had signed up to the Artemis Accords and expressed a desire to have their CubeSats among the secondary payload, so it was clearly useful.
Having read in to the issue, I discovered that there is more to the story than a change in views. During a presentation at the Small Sat Conference in August this year in Salt Lake City, the NASA SLS Payload Integration Office reportedly stated that the reason for not taking a payload of CubeSats was down to changes in the configuration. While the aim was for Artemis 3 to be a lunar landing mission, it is now going to be part of a collaboration with SpaceX and Blue Origin, who are developing lunar landers themselves. Artemis 3 would instead become a low earth orbit test of the Orion spacecraft docking with those private sector lunar landers.
The configuration has changed, but the commitment to carrying CubeSats in its payload has apparently not. However, there are consequences for the exploration of new destinations and trajectories that are normally quite difficult and very expensive to reach. Put simply, our ability to learn in a way that is relatively inexpensive is curtailed, affecting all stakeholders.
The other view is that the ICPS [Interim Cryogenic Propulsion Stage] is being saved for a mission where it is needed. If used in the upcoming Artemis 3 mission, even to accommodate the CubeSat payload, it’s a significant expenditure that could be avoided as it is not needed for its newly designated orbital mission.
Not having the 'trans-lunar capability makes this mission different, but perhaps justifiably so. But there's an interesting bigger picture: this does not mean SLS CubeSat rideshares are ending. NASA says it's already discussing CubeSats for Artemis 4 and later, and the architecture has a purpose-built ring called the "Nest" for mounting CubeSats when mass and volume permit.
So, I would interpret the news primarily as a consequence of the Artemis 3 redesign, rather than NASA deciding that CubeSats aren't worthwhile. I do also think that the further developing links between NASA missions and private sector players like SpaceX and Blue Origin means the cost of such missions in the future can be reduced for all parties.
[ Back to Top ]


By John D. Moore, Executive Director, Institute for Earth Observations at Palmyra Cove, New Jersey
Much of my recent work in space education has emphasized Let's Go to Space. We need to inspire the next generation of aerospace engineers, scientists, technicians, and other professionals who will design and operate the systems that take us there. This falls just short of a potential national aerospace engineering mandate.
During my 2009–2011 Einstein Fellowship at the National Science Foundation, Kevin Simmons and I began discussing the potential of CubeSats as a disruptive educational technology. The idea was simple but powerful: students should have opportunities to build, launch, utilize, and educate using spacecraft rather than simply study them.
The future also will require a generation capable of using those systems and the data they produce, as the applications become even more a part of our daily lives commercially, and militarily. As written often in previous editions of John’s Journey, this is the rationale of the Acquire – Analyze – Apply (A3) model.
I believe we are now entering an important new phase in Earth and Space education through the evolution of the GLOBE Program.
GLOBE is moving toward stronger connections with NASA's Earth-observing and crowd-sourcing activities, creating opportunities for students and teachers to collect scientifically meaningful ground observations that complement, validate, and help interpret satellite observations from current and future missions including PACE (Plankton, Aerosol, Cloud, ocean Ecosystem), NISAR (NASA-ISRO Synthetic Aperture Radar), and TEMPO (Tropospheric Emissions: Monitoring of Pollution).
More recently, the GLOBE Program now matches citizen science cloud observations with data from NASA's PACE satellite when student ground-observations happen within 15 minutes of the satellite passing overhead.
This represents more than a programmatic change. It provides an opportunity to redefine the role of the student.
While GLOBE has developed a remarkable international community of educators and students experienced in authentic Earth-system observations, the Satellite Educators Association (SEA) brought together educators and professionals working with satellites, remote sensing, aerospace engineering, and space-based applications. These two communities are natural partners. Future discussions are needed to evolve such partnership.
The emerging small-satellite ecosystem, including PocketQube technologies and commercial Earth-observation concepts, makes it increasingly possible to place meaningful sensing capabilities within educational reach. The important question is therefore no longer simply: Can students build a satellite? It is: What can students learn by using a satellite to observe Earth, and how can those observations be connected to what they observe on the ground? That is the question I want to explore next.
My initiative, Let's Learn from Space, brings these ideas together. It connects satellite missions, remote sensing, GLOBE ground observations, small-satellite technology, data analysis, engineering, and environmental inquiry into a single educational pathway. The initiative is not simply another satellite project or another CTE/STEM activity. It is a shift in how we think about the educational purpose of space technology: Students don't simply learn about satellites. They use satellite observations to investigate Earth. They Acquire authentic observations, Analyze relationships between space-based and ground-based data, and Apply their understanding to scientific, environmental, and engineering problems.

That is the direction I will introduce at this year's SmallSat Education Conference while suggesting we take a look at its broader impacts as the conference moves forward rapidly. Broader impacts include integration of disciplines like Geosciences and Earth System Science and a synergy we can anticipate. There are additional broader impacts at the national level. Although these are key items directly related to national economy and national security, they are almost non-existent in pre-college education especially in areas of workforce readiness. Is it time to look at what we teach, and why?
Let’s Learn from Space builds on more than four decades of work in Career and Technical Education, Earth observation, remote sensing, satellite education, aerospace engineering, and on a continuing belief that education should evolve with the technology and the challenges facing our planet. Teachers can get an immediate jump-start by taking advantage of the expertise of past and present educators found in SEA’s online knowledgebase Using Satellites in Education and More Lessons from the Sky (the SEA Lesson Plan Library).
As a recipient of the National Space Club and Foundations’ Education Award (Christa McAuliffe Award), I am compelled to develop this next phase not simply as a continuation of my work, but as an opportunity to help connect communities that have historically worked in parallel: Earth science educators, GLOBE practitioners, satellite educators, aerospace engineers, and the emerging small-satellite community.
The journey that began with remote sensing, computer visualizations, and applications of satellite imagery continues. But the question has evolved. We know how to observe Earth from space. Now, let's learn from what we observe, and teach the next generation to do the same.
More on Let’s Learn from Space will appear in future editions of John’s Journey.
Remember -- you can teach anything with satellites.
Stay safe … stay well!
For now, I'm John...and this is my journey.
[ Back to Top ]


By Steve Mills, Retired Systems Engineering Scientist; owner and Chief Engineer of Polymath Geo
When discussing the history of the space race, a very significant milestone is not often mentioned. In 1960 the USA launched the very first remote sensing weather satellite, TIROS-1. USSR would not launch their first weather satellite, Kosmos-44, until four years later in 1964. In the 1960’s the Apollo Moon landings received most of the attention, but with respect to people’s day-to-day lives. The introduction of weather satellites had a much more lasting impact. In this article we will consider just how important weather satellites are for weather forecasting.
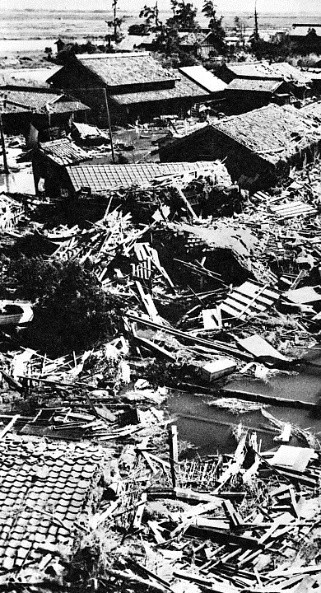
So, consider the world before there were weather satellites. For example, Typhoon Vera struck Japan on September 26, 1959, and though weather forecasters did predict that it would make landfall in Japan, they could not forecast its strength, or exactly where it would have its greatest impact. Also, at that time weather forecasting was not very reliable, and so people often did not take the forecasts seriously. Therefore, the news media did not give Vera much attention, so most people did not prepare or evacuate. Its full impact will never be known, but Vera is estimated to have caused more than 5,000 deaths and injured almost 39,000 people, making it one of the worst typhoons in Japanese history.
Of my 45 years in the aerospace business, I spent about 16 years working on earth-observing remote sensing weather satellite programs, so this is a topic that is close to my heart. It is also a very broad topic, so in this column I will focus specifically on how satellites are used for weather forecasting. In my next column I will discuss how earth-observing satellites are used in the study of climatology and other environmental monitoring.
Before any further discussion, let me define a few terms here:
Before 1960 meteorologists had to depend exclusively on in-situ measurement devices to make forecasts. Specifically, these devices were thermometers to measure temperature, barometers to measure atmospheric pressure, hygrometers to measure humidity as well as a host of other specialized metrological devices. Meteorologists still use all these devices, and I will explain later why remote sensing satellite measurements cannot replace in situ measurements. In situ and remote sensing data enhance each other.
Of course, in situ measurements are taken at meteoritical stations, but they are also taken from weather balloons with radiosondes that transmit the data back to the ground as they slowly rise into the upper atmosphere. Also, weather agencies have buoys in the ocean and in large lakes to make in situ measurements of the water and of the air. And commercial ships take in situ measurements and voluntarily share this data with weather agencies. Commercial airliners also do the same. (https://www.weather.gov/about/observation-equipment
Taken together, all this situ data covers much of the Earth, but still there are large uninhabited regions of the planet (especially in the oceans and at the poles) without any coverage. This is why satellite remote sensing is so important.
Computer weather models used for forecasting require initial conditions over the entire globe to be effective. This includes not just conditions on the ground, but at all altitudes up to the top of the atmosphere. This is where remote sensing becomes important, as it fills in the gaps of the in situ data. Unlike in situ measurement, remote sensing instruments do not actually measure the weather. Instead, they measure radiance, and from that they can calculate the weather conditions using algorithms.
There are two types of remote sensors -- passive and active. Passive remote sensors measure radiance, reflected solar radiance or emitting emitted radiance. For example, sunlight reflecting off of a cloud will reflect equally at all visible wavelengths, and will be perceived as white. Sunlight reflecting off vegetation will reflect green light strongly but will absorb blue and red light and will be perceived as green. In this way the human eye acts as a remote sensor. For infrared sensors, the warmer an object is, the higher the frequency of the electromagnetic radiance that it will emit. Using this fact, and measuring the wavelengths and intensity of the emission, a remote sensor can use a mathematical formula to deduce the temperature of an object. This same principle is used for a medical infrared thermometer.
The most familiar active remote sensing device is the weather radar. Weather radars can detect clouds, rain, snow and other forms of precipitation. A Doppler Radar uses the Doppler effect to detect the velocity of moving objects, in particular rain and other forms of precipitation. Weather radars are commonly used on the ground or based on aircraft. They are not generally used on weather satellites but there have been a few exceptions to this.
Weather satellites have two types of orbits -- geostationary and polar orbiting. Here is how these are defined:
Geostationary orbit (GEO) – In this orbit a satellite remains in a fixed position over the earth, orbiting over the equator at the same rate as the earth’s rotation. Therefore, it always sees the same part of the Earth’s surface. Geostationary satellites have a very high altitude, exactly 35,786 km (22,295 miles).
Polar-orbits – In this low earth orbit (LEO) satellites circle the Earth approximately from pole to pole, and have altitudes ~700 to 880 km (approx. 435–550 miles). At these altitudes a satellite has an orbital period of about 99 to 103 minutes (about 14 orbits per day). For polar orbiting satellites the Earth rotates underneath the path of the satellite so that the sensors on the satellite will see every place on Earth at least twice per day, once in daylight and once at night. They see areas near the poles on every orbit. Most polar orbiting weather satellites are sun synchronous, that is, the plane of their orbit is constant with respect to the sun.
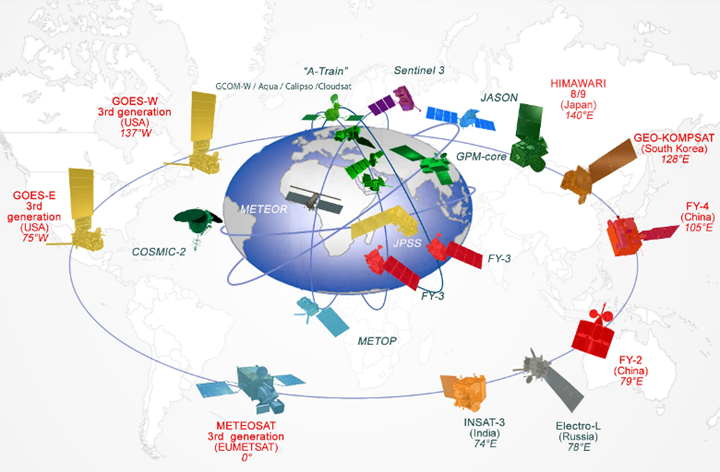
The illustration above shows many of the geostationary satellites orbiting around the Earth’s equator as well as the polar orbiters that are much closer to the Earth. If the illustration were animated the Earth would be rotating once per day with the geostationary satellites orbiting in lock step with the rotation of the Earth. A polar orbiting satellite would be in a fixed plane repeating their orbit every 100 minutes with the earth rotating underneath it.
You may notice that many different nations have these weather satellites, and you may wonder whether they share their data with other nations. Fortunately, they do. This is because of a treaty known as the Convention of the World Meteorological Organization (or WMO Convention for short). The signers of this treaty include almost all nations of the Earth, and it requires that meteoritical data be shared with all other nations in the treaty. Data that must be shared includes all in situ data and remote sensing data in the possession of a national weather agency. The treaty applies even during war, although nations have sometimes ignored that requirement. The WMO Convention allows meteorologists to have a complete set of global data, which allows them to forecast the weather accurately.
The position of the sun is important for GEO satellites because once per day they will be facing the sun when it is close to or moves behind the Earth. This may temporarily blind the satellite. For a polar-orbiting satellite the sun is always off to the side or behind it, so it is never blinded.
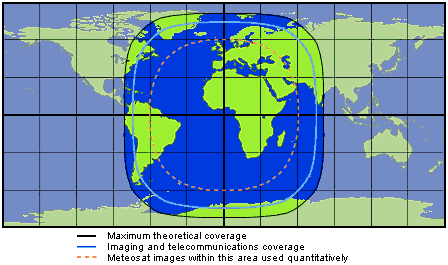
Note in both the illustration of orbits and Meteostat field of view image that the Meteosat 3rd Generation satellite is directly over the 0° Longitude, 0° Latitude point, that is, where the equator and the prime meridian intersect. The field of view image shows the region of the Earth that can be viewed from this satellite. In theory, it can see out to the black line, but at that point it is looking at the Earth on edge and there is very little useful meteorological information. (This is known as a limb view of the Earth, and it is useful for understanding the vertical structure of the atmosphere but provides no information about the horizontal structure of the atmosphere.) The dashed orange line is the limit that the European Meteosat program considers useful data. Note that this region extends from latitude 60° N to 60°S. There are 9 geostationary satellites shown orbiting around the equator, so the entire region of the Earth is covered between, 60° N and 690° S Latitude. Still, the high latitudes are not covered, and that is why polar orbiter satellites are essential.
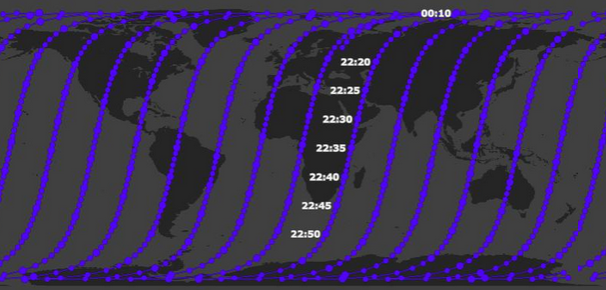
NOAA-21 is a polar orbiting weather satellite, and on each orbit the path shifts about 2800 km at the equator as the Earth rotates underneath the satellite. The radiometers onboard measure a swath on the ground that is about 3000 km, so the entire surface is measured with some overlap at the equator. The figure shows only the descending node of the orbit, that is the nighttime side of the orbit where the satellite is descending from north to south. The ascending side also includes 14 flight paths moving south to north during the day.
The primary remote sensing instruments on all weather satellites are radiometers. These are generally passive radiometers that measure electromagnetic energy that is reflected off or emitted from some part of the Earth. These electromagnetic radiances include ultraviolet light with wavelengths as short as 0.25 micrometers up to microwaves as long as 13 mm (23 GHz). The table below gives the meteorological instruments on the two US NOAA weather satellite models, JPSS and GOES-R. The European Organisation for the Exploitation of Meteorological Satellites (EUMETSAT) and other meteorological agencies for India, China, Japan and Russia all have similar satellites with similar remote sensing instruments onboard.
Converting radiances into meteorological or environmental parameters requires complex algorithms. What is important to know is that these algorithms must be trained and improved using actual in situ data from the same time and place on the Earth. The results of the algorithm are compared with in situ data, and then the algorithm is fine-tuned to be as close as possible to the in situ data. This is why satellite data could never replace in situ data. Without this training satellite data is useless.
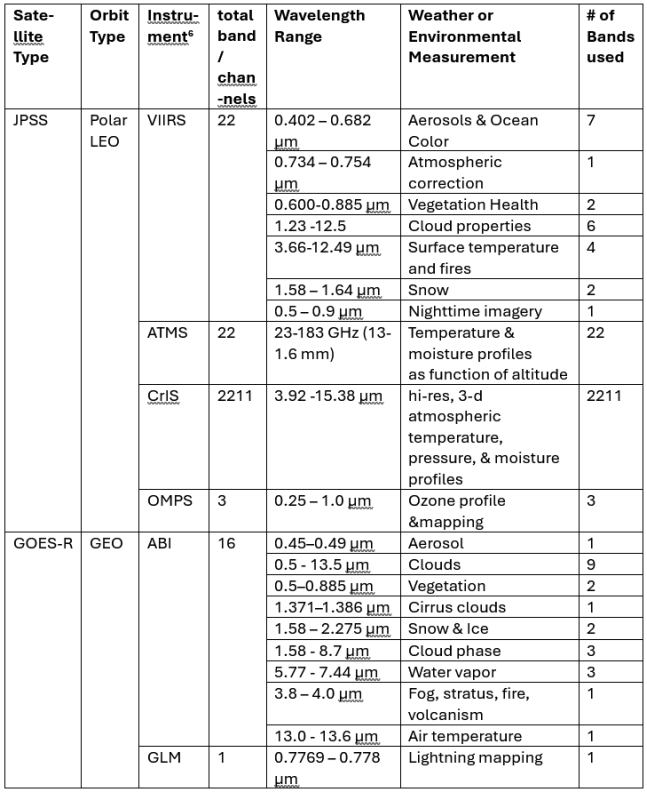
Satellite instruments must be regularly recalibrated. Otherwise, their response will drift. Ground calibration is a regular part of weather satellite programs. A team of scientists will go to flat and uniform places (usually in deserts) and measure the radiance with accurate radiometers. At the same time, a satellite is looking at that point on the ground, and the radiances from the satellite and from the ground are compared, and corrections are made based on this. Also, when two satellite paths approximately cross, seeing the same path of the Earth at the same time, the results of the two are compared, and adjustments are made. This is called cross-calibration.
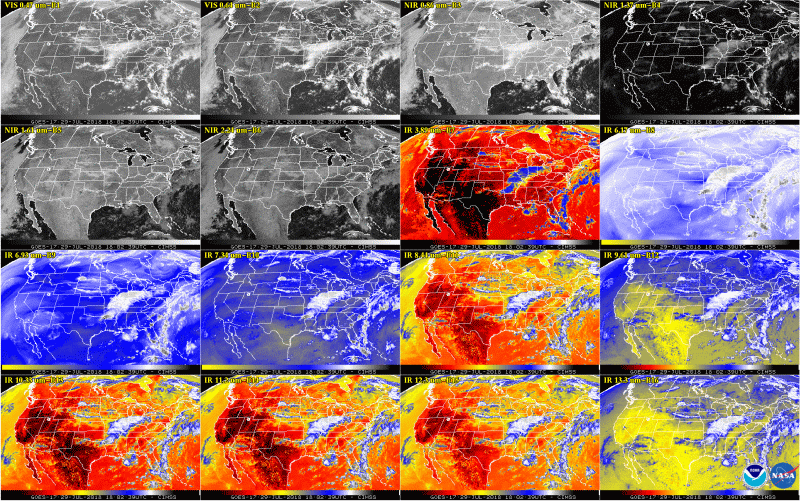
The image montage below shows a view of North America with the 16 GOES bands. The human eye has effectively 3 bands (red, green and blue), and we can tell the difference between a white rain cloud and a brown smoke cloud. In the same way the GOES algorithms use the ratios among different bands to determine what is being viewed. This data is further combined with in situ data to produce a 3-dimensional initial conditions computer model. These are combined with other weather agencies to produce a model of the entire earth’s atmosphere at a given time. Using the laws of atmospheric physics, a computer program projects the model into the future and can make a forecast of the weather for any place on Earth.
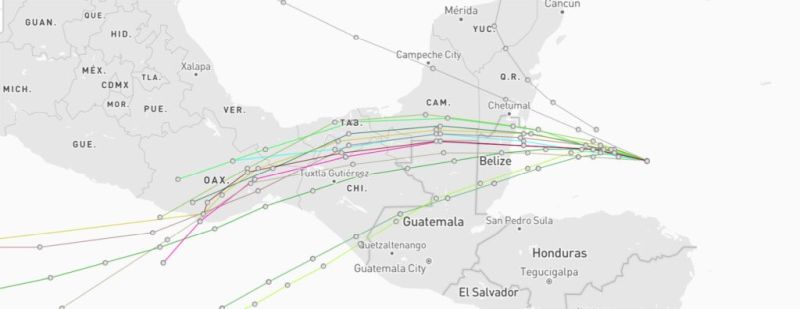
Because of chaos theory, small changes in the initial conditions will change the results quite dramatically in a forecast. Meteorology forecasters use this fact, and make small random variations in the initial conditions, and rerun the model over and over. The forecast therefore becomes a probability, rather than an exact prediction. A good way to illustrate this is with a spaghetti plot of a hurricane as shown below. Where all the paths converge, East of Belize in the Caribbean, that is the present time, when the location is exactly known. Ten of the paths are bunched together with 2 paths veering significantly north and 2 more veering significantly south. These 4 cases are called outliers. These 14 cases are not all the cases that were modeled in the forecast, and the outliers are shown so that people understand the full range of possible paths.
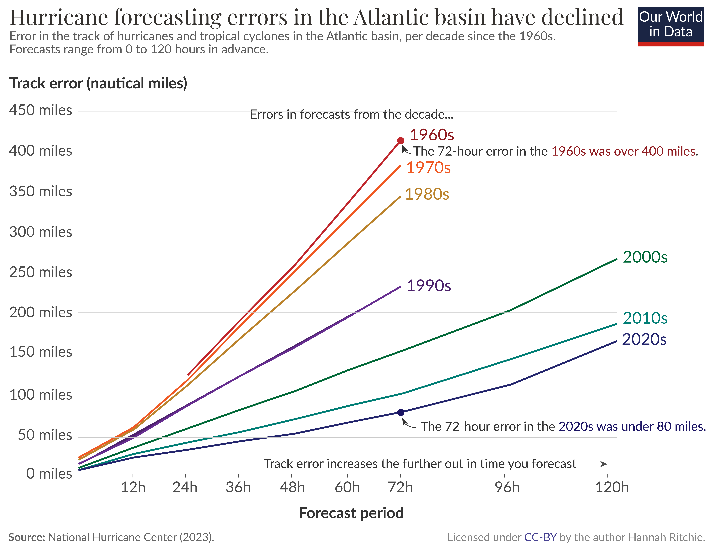
So, 64 years after the first weather satellite was launched, how much better off is the world because of weather satellites?
Based on records from the US National Hurricane Center, the ability to track hurricanes 3 days (72 hours) in advance in 2020 was 5 times better than it was in the 1960s. Before 2000 forecasters did not even bother to predict the track of hurricanes more than 3 days in advance, but during the 21st century 5-day forecasts have become standard. In fact, a 5-day forecast in the 2020’s is now more accurate than a one day forecast in the 1960’s. This is illustrated in the hurricane forecasting graph below. These data are specifically for the Atlantic basin, so these statistics may not apply equally to typhoons in the Pacific.
General forecasting has also improved significantly since at least 1980. Data from European Centre for Medium Range Weather Forecasts (ECMWF), shows that 5 day forecast in 2018 was better than a 3 day forecast in 1980. The improvement is more dramatic when the results are compared for the Southern Hemisphere. A 7 day forecast in the Southern Hemisphere has improved from about 30% in 1981 to 70% in 2018. This is because weather forecasting is now done globally. In the 1980’s national weather services focused their resources on forecasting weather in their own region. The US did not fully consider that the weather in the Indian Ocean could affect the weather in the US in 7 days. Notice in accuracy graph below that after the year 2000 the curves for the Northern and Southern Hemisphere begin to converge. This is when weather agencies began to use super-computers to run whole Earth forecasts. Before that time because of the limitations of computer resources, forecast models were more focused on regional weather, and if other parts of the globe were included at all, they were modeled at a lower resolution.
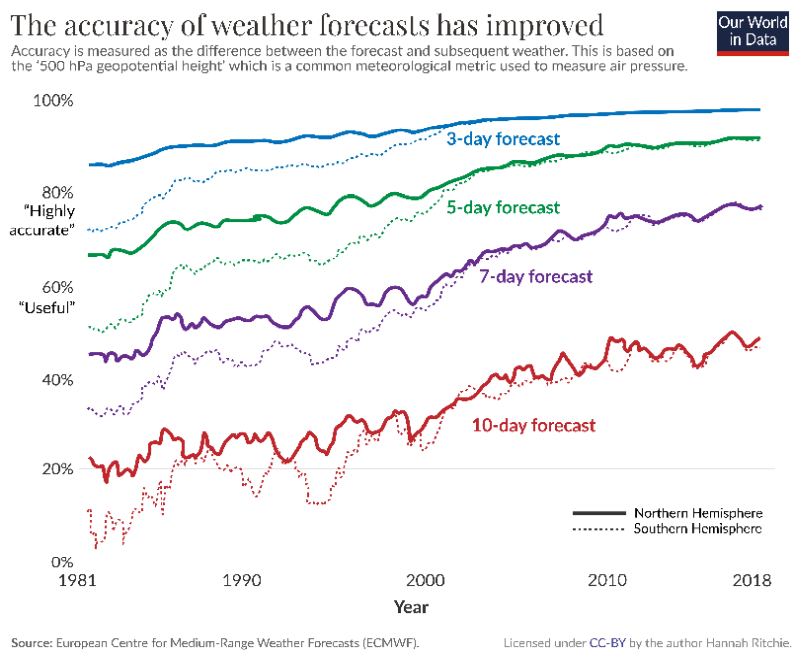
It is important to note here that the improvements in forecasts shown in forecasting and accuracy graphs above are not due only to more and better weather satellites. They are also due to the vast improvements in computing power over this period. Will the future see improvements due to AI? This is a question worth considering.
I will consider how these same satellites that are used to understand and predict the weather are also used to understand and predict climate.
[ Back to Top ]


By SEA Newsletter Staff
Established as a civilian agency in 1958 during the Eisenhower presidency, the National Aeronautics and Space Administration (NASA) has continuously pushed the boundaries of scientific and technical limits to explore the unknown for all the citizens of our planet. The United States then entered the "space race" with artificial satellites that carried remote sensing capabilities. On May 5, 1961, President John Kennedy called on a Joint Session of Congress to support landing a man on the Moon and returning him safely home before the end of the decade. September 12, 1962, in a speech at Rice University, President Kennedy answered the question of why go to the Moon. "We choose to go to the Moon. We choose to go to the Moon in this decade and do the other things, not because they are easy, but because they are hard; because that goal will serve to organize and measure the best of our energies and skills, because that challenge is one that we are willing to accept, one we are unwilling to postpone, and one we intend to win." NASA was born into a world of the Cold War and met the challenge.
In October 1983, these comments from then NASA Administrator James M. Beggs were included as prologue in the NASA 25th Anniversary Press Kit.

"We did not get to our present position of leadership in space by accident.
"We got there because we had the imagination to dream great dreams and the national will to fulfill them.
"We got there because the partnership of government, industry and our universities, built up over the years, created a scientific and high technology base second to none.
"We got there for the good common sense reason that we have learned to build on our achievements as we go along -- and to learn from our experience. As Shakespeare wrote: 'Experience is by industry achieved and perfected by the swift course of time.'
"We have had our struggles and our successes in the program over the swift course of NASA's 25-year lifetime. And they have been open for all the world to see, beginning with the launch of our first satellite, Explorer 1. They range from the succession of planetary explorers -- the Mariners, the Pioneers, the Vikings and the Voyagers; through the Mercury, Gemini and Apollo programs to the development of the Shuttle.
"All would never have been possible had we not built on past experience. And, largely because we have done so, we became the leaders."
The list of accomplishments for NASA and the United States during this period is inspiring.
The Cold War, which began shortly after World War II in 1947, ended when the Soviet Union dissolved in 1991. A new era of international cooperation began to explore human movement into space.
The Hubble Space Telescope gave us eyes to the universe with a clarity never before imaged starting in 1990.
The International Space Station began in 2001 has provided continuous information about the effects of living in space on the human body as well as countless research topics too numerous to list.
In 2011, after 135 missions, the Space Shuttle fleet was retired.
During this period, private industry made its foray into the space flight enterprise.
The James Webb Spaced Telescope, launched in 2021, carries a unique mirror system that enhances its ability to "see" places in the universe we could not distinguish before even with the Hubble Space Telescope.
The current direction for the United States is for a return to the Moon to explore long-term human presence there, resources the Moon may provide, and planning for future human outreach to other planets in the Solar System.
The human exploration of space always seems to take the headlines. Nonetheless, the long term, continuous, robotic exploration of almost every planet in the Solar System, especially Mars, cannot go without special mention. This is, perhaps, the most informative space legacy of NASA today. From the astounding success of the Voyager missions - including a spacecraft launched in the 1970s that has left the Solar System and is still somewhat operational - to robotic rovers on Mars sending important data about the structure and condition of that planet, NASA continues to achieve and inspire as it freely adds to our library of knowledge and shares innovative technologies for the common good.
Can we still dare to dream great dreams? Will there be an authentic national will to achieve them?
This historical summary of NASA is not meant to be all inclusive. It is just not possible to include the thousands of NASA employees and industry workers who contributed to the accomplishments mentioned above and much more. The SEA Newsletter staff recognizes that each and every one of them had an important part, large or small, to play in each NASA event whether listed above or not.
[ Back to Top ]

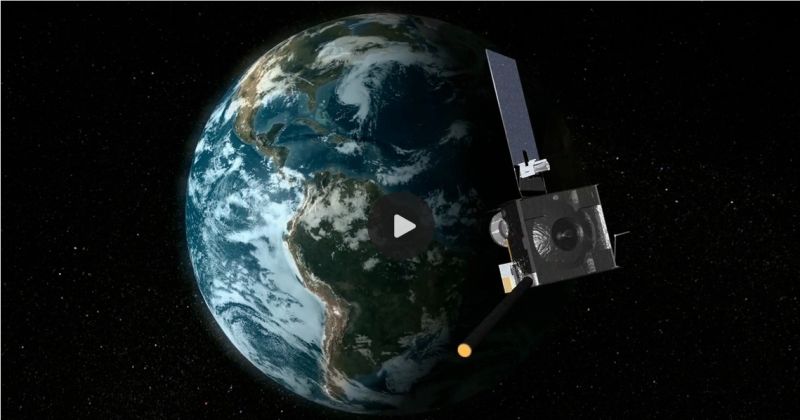
From NOAA's Ocean Today
at https://oceantoday.noaa.gov/satellites/
[ Back to Top ]
From NASA Jet Propulsion Laboratory, California Institute of Technology
at https://www.jpl.nasa.gov/news/nasa-engineers-help-prolong-voyager-2s-science-mission/
August 4, 2026
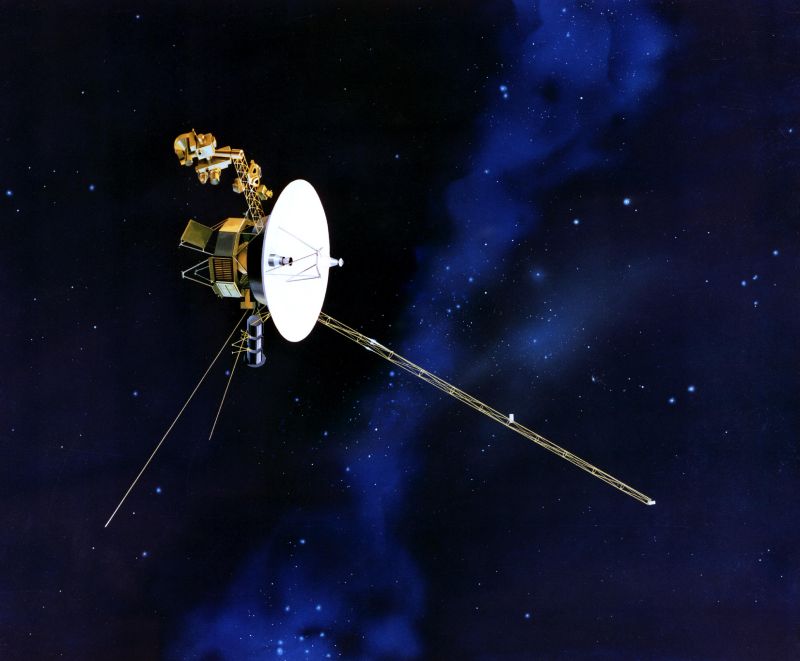
Nicknamed the "Big Bang," the effort involved simultaneously turning off certain powered devices and substituting them with lower-power alternatives while ensuring the spacecraft remains warm enough to operate.
The Voyagers get their power from radioisotope thermoelectric generators, devices that convert heat from decaying plutonium into electricity. Due to the plutonium supply continually depleting, both probes lose about 4 watts of power each year. After almost a half-century since launch, the spacecraft power margins have grown razor thin, requiring the team to conserve energy by shutting off non-essential devices and systems. The savings from the Big Bang should provide power to keep its three instruments operating for at least an extra year.
[ Back to Top ]
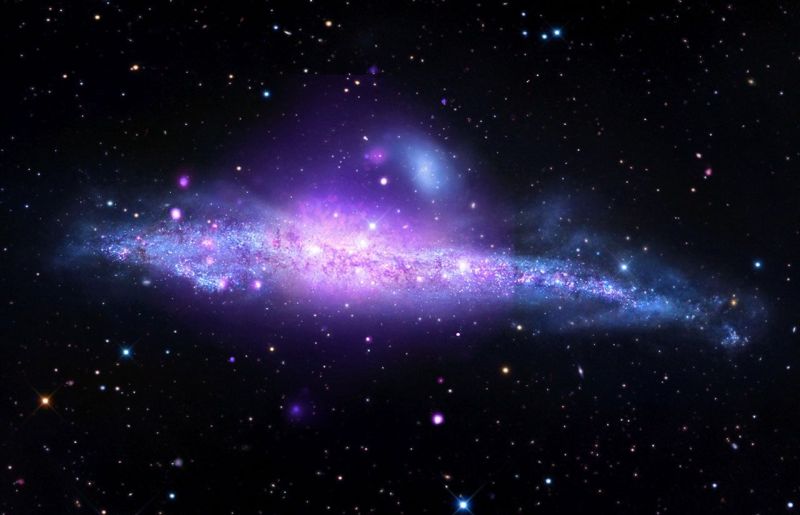
Two more satellites -- one 26 years in space, the other new -- give us sharper information about distant galaxies and exoplanets.
[ Back to Top ]


By Erin Morton, NASA Science Editorial Team
at https://science.nasa.gov/blogs/science-news/2026/08/05/nasas-new-horizons-finds-evidence-of-recent-liquid-on-plutos-surface/
August 5, 2026
A new analysis of imagery collected during NASA’s New Horizons spacecraft’s 2015 encounter with Pluto provides evidence that liquid nitrogen is rising to Pluto’s surface through cracks in the northern edge of the Sputnik Planitia, part of the massive heart-shaped glacier on the dwarf planet’s surface. This is the first evidence of recently flowing liquid on Pluto.
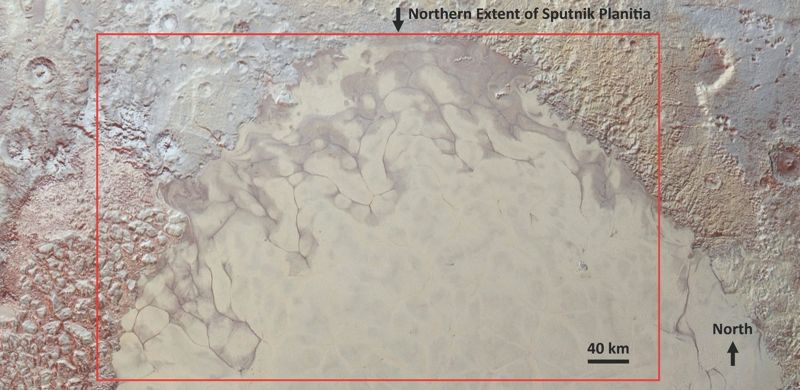
"Pluto never stops surprising us," said Alan Stern, principal investigator of New Horizons and lead study author from the Southwest Research Institute in Boulder, Colorado. "In addition to suggesting that liquids have recently expressed themselves on Pluto’s surface, this result also suggests a new kind of time-variable feature on Pluto."
[ Back to Top ]
From NOAA Research
at https://research.noaa.gov/high-altitude-observations-confirm-stratospheric-source-of-toxic-groundwater-contaminant/
August 5, 2026
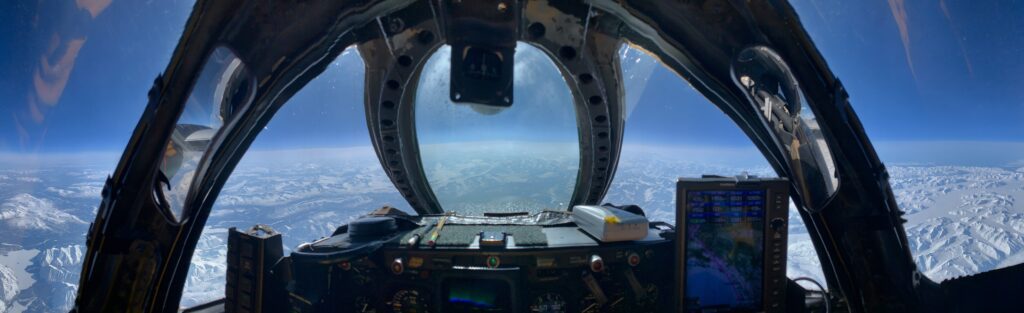
A new study led by NOAA Research has confirmed that a substantial amount of groundwater contamination caused by perchlorates, a class of toxic chlorine-based chemicals, originates in a surprising place – the stratosphere. The study, led by researchers at NOAA’s Chemical Sciences Laboratory (CSL) and published in the journal Proceedings of the National Academies of Science, provides new evidence linking perchlorate formation to tiny airborne particles (aerosols) in the stratosphere, the layer of the atmosphere 7 to 30 miles above Earth’s surface.
The study analyzed detailed aerosol chemical measurements collected from high-altitude research aircraft in the lower stratosphere, where the vast majority of particles in the thin air are made of sulfur dioxide. But the scientists found perchlorates were almost entirely bound to aerosol particles originating from biomass burning and nitrogen-rich sources, which are transported into the stratosphere by atmospheric circulation and by towering plumes of wildfire smoke. While these particles make up only a small fraction of the total stratospheric aerosol population, they carry nearly all of its perchlorate load.
"This was a real surprise," said lead author Daniel Murphy, who heads CSL's Aerosol Properties & Processes research program. "We found that perchlorate avoids the most common stratospheric aerosol particles, which are mostly sulfuric acid. Instead, it clings to particles with more organic content and less acidity -- like those from wildfires."
[ Back to Top ]


From NASA Earth Observatory
at https://science.nasa.gov/earth/earth-observatory/a-changing-world-for-emperor-penguins/
August 26, 2026
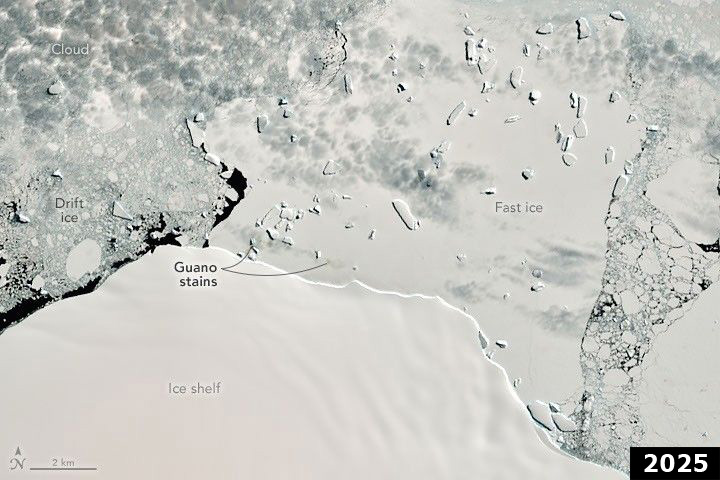
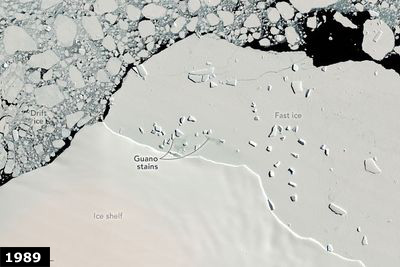
With their charming waddles, heat-conserving huddles, and tuxedo-like plumage, emperor penguins are among the world's most recognizable animals. Recent satellite surveys estimate that hundreds of thousands of the flightless birds live in 66 colonies spread around Antarctica's inaccessible, frozen coastlines. But those numbers could fall in the coming decades because emperor penguins rely on landfast (or fast) ice -- a type of sea ice attached to the shoreline -- to breed, raise chicks, and molt.
While Antarctic sea ice remained relatively stable between the late 1970s and 2015, it has been declining since 2016, and climate projections suggest that trend will continue. How landfast ice is faring remains poorly understood and is an active area of study. However, one study suggests that it has declined in West Antarctica and the Weddell Sea in recent decades even as it has trended upward in the Bellingshausen Sea and East Antarctica.
Meanwhile, some models project that emperor penguins could disappear by 2100 due to their habitats becoming inhospitable. The U.S. Fish & Wildlife Service listed emperor penguins as threatened in 2022, and the International Union for Conservation of Nature classified them as endangered in 2026.
[ Back to Top ]
By Sally Younger, NASA Explore
at https://science.nasa.gov/blogs/science-news/2026/08/24/nasa-supported-study-tracks-carbon-cost-of-coastal-erosion/
August 24, 2026
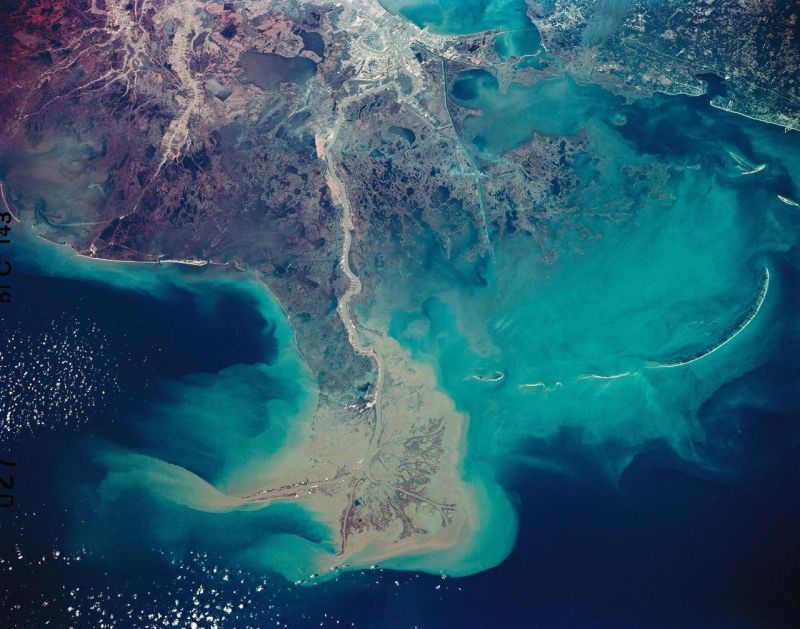
From Texas to Maine, coastal wetlands and marshes are releasing more than 1.45 billion pounds (660,000 metric tons) of carbon into the ocean each year, according to new research supported by NASA.
Coastal marshes, like forests and tundra, store large amounts of carbon in their plants and soil, but changes caused by storms, rising seas and human development can affect how that carbon is stored and transported.
The authors of the new study analyzed Landsat imagery along with lidar elevation data from the U.S. Geological Survey to track marsh loss along the Gulf Coast and Eastern seaboard between 1985 and 2022. They estimate that while some of the carbon released by erosion is offset by new marsh growth, the net loss is still around 800 million pounds (380,000 metric tons) of carbon every year.
[ Back to Top ]


From the NOAA Weather Program Office
at https://wpo.noaa.gov/experimental-atmospheric-river-forecast-model-goes-online/
March 17, 2026
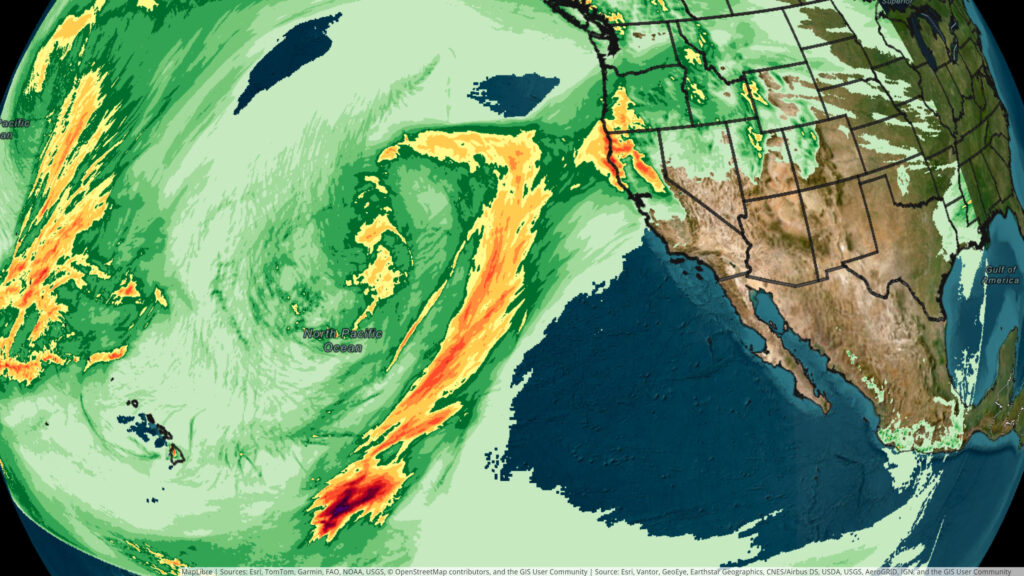
NOAA will gather feedback while doing further model development and testing. AR-AFS could move from being an "experimental" model to an "operational" one — used for official, everyday use — by autumn 2028.
Developing and evaluating this forecast model is just one component of NOAA’s broader initiative to improve AR forecasts, titled the Atmospheric Rivers Forecast Improvement Project. Other aspects include investigating economic impacts of ARs and how observations from aircraft and balloons affect model accuracy.
The project is a collaboration among among NOAA’s Weather Program Office, Global Systems Laboratory, Physical Sciences Laboratory, Weather Prediction Center, Environmental Modeling Center, and Air Resources Laboratory; the Cooperative Institute for Research to Operations in Hydrology (CIROH); and the Center for Western Weather and Water Extremes (CW3E).
Find this and related posts at https://wpo.noaa.gov/experimental-atmospheric-river-forecast-model-goes-online/.
[ Back to Top ]
From NOAA National Weather Service
at https://www.weather.gov/news/260803-gtgn
July 30, 2026
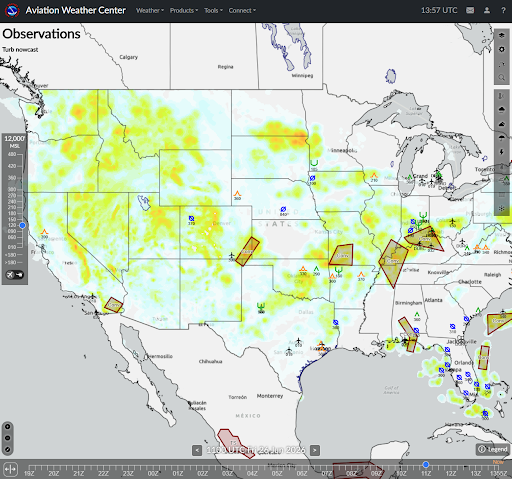
On July 30, the National Weather Service’s Aviation Weather Center (AWC) debuted a new tool to help pilots navigate the (occasionally) bumpy skies.
The Graphical Turbulence Guidance Nowcast (GTGN) has upgraded features that commercial pilots can use to anticipate features that aren’t always captured by traditional weather forecast models. With sponsorship by the Federal Aviation Administration, the AWC worked with the National Centers for Atmospheric Research (NCAR) and the Colorado State University Cooperative Institute for Research in the Atmosphere (CIRA) to facilitate GTGN through the Aviation Weather Testbed research to operations process.
[ Back to Top ]


By SEA Newsletter Staff
August 30, 2026
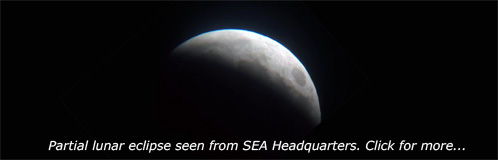
Friends of SEA Secretary Paula Arvedson traveled to Spain in August 2026 especially to observe a solar eclipse. Their location was overcast, and they missed the whole thing. The rest of their vacation in Spain and Portugal made up for some of the disappointment. Later in the month, SEA Member Paul London with telescope and camera ready, observed the August 27-28 lunar eclipse from SEA Headquarters in Pasadena, California.
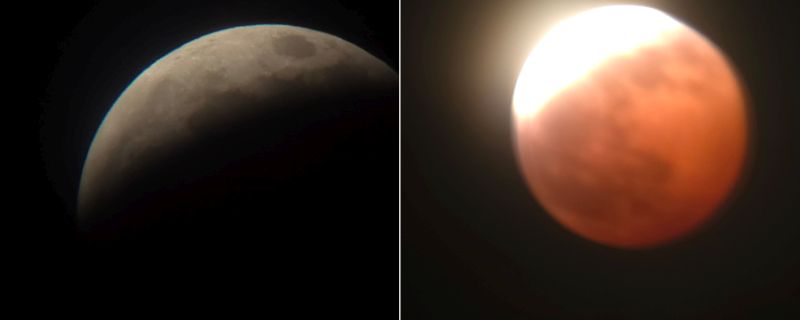
More information about this eclipse is provided by NASA's Scientific Visualization Studio:
On August 28, 2026 (the evening of the 27th in some time zones), the Moon passes into the shadow of Earth, creating a deep partial eclipse. At the moment of greatest eclipse, 4:13 a.m. Universal Time, 96.3% of the Moon's disk is within Earth's umbra, the central part of the shadow where the Sun is completely blocked by Earth. This part of the eclipse is visible in the Americas (except Alaska and northwestern Canada), western Europe and western Africa.
[ Back to Top ]
By Ashley Balzer, NASA Explore
at https://science.nasa.gov/missions/roman-space-telescope/9-things-to-know-about-nasas-nancy-grace-roman-space-telescope/
August 30, 2026
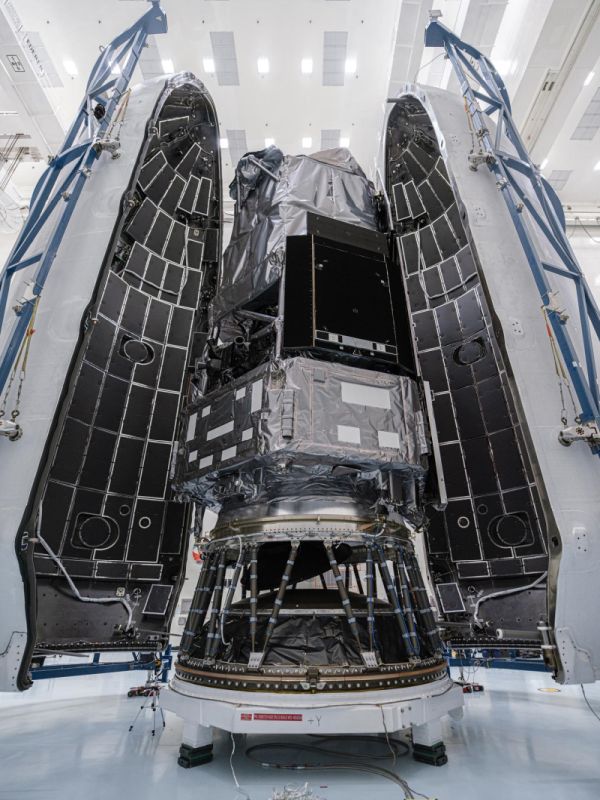
NASA’s Nancy Grace Roman Space Telescope was launched at 7:26 a.m. EDT on Sunday, Aug. 30. Here you can brush up on some key facts about this wide-view mission.
[ Back to Top ]
Adapted from NOAA News & Features
at https://www.noaa.gov/understanding-el-nino
June 10, 2026
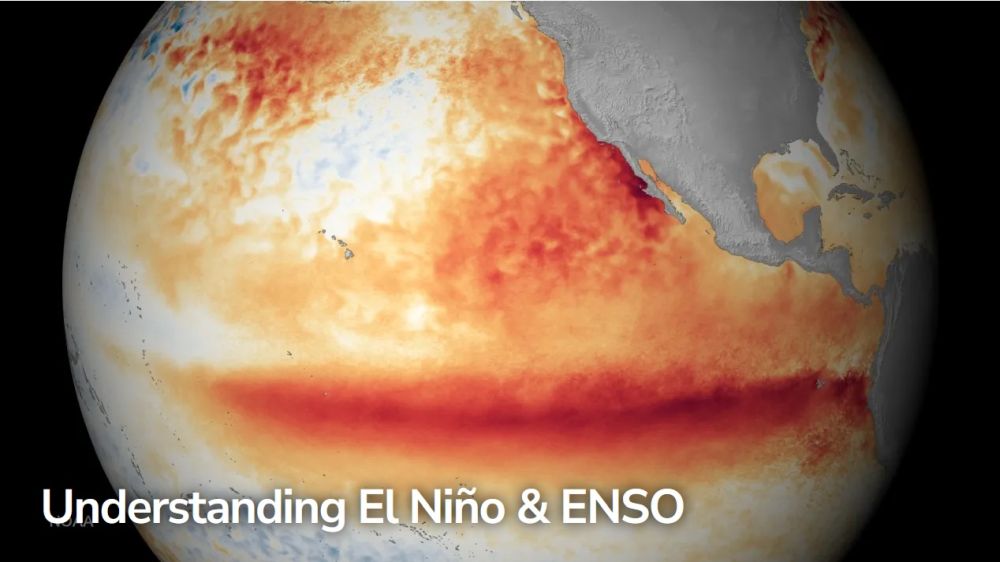
The Pacific Ocean’s El Niño-Southern Oscillation (ENSO) is arguably the most influential climate driver on Earth. Its cycles of warm and cool waters in the central and eastern equatorial Pacific alter where ocean heat is released into the atmosphere, influencing atmospheric circulation, temperatures, precipitation and other weather events that affect agriculture, wildfires and marine fisheries around the globe.
This is a four-part offering with lots of resource links on the side. Each of the four parts is informative, to the point, illustrated, and sequenced in a helpful order. The four parts are:
[ Back to Top ]


Excerpted from Next Generation Science Standards For States, By States at https://www.nextgenscience.org/
Based on the National Research Council's K-12 Framework for Science Education, the Next Generation Science Standards (NGSS) were developed by 26 Lead State Partners and collaborators including the National Research Council, the National Science Teachers Association, and the American Association for the Advancement of Science. The work began in the summer of 2011; the NGSS were released for adoption in April 2013.
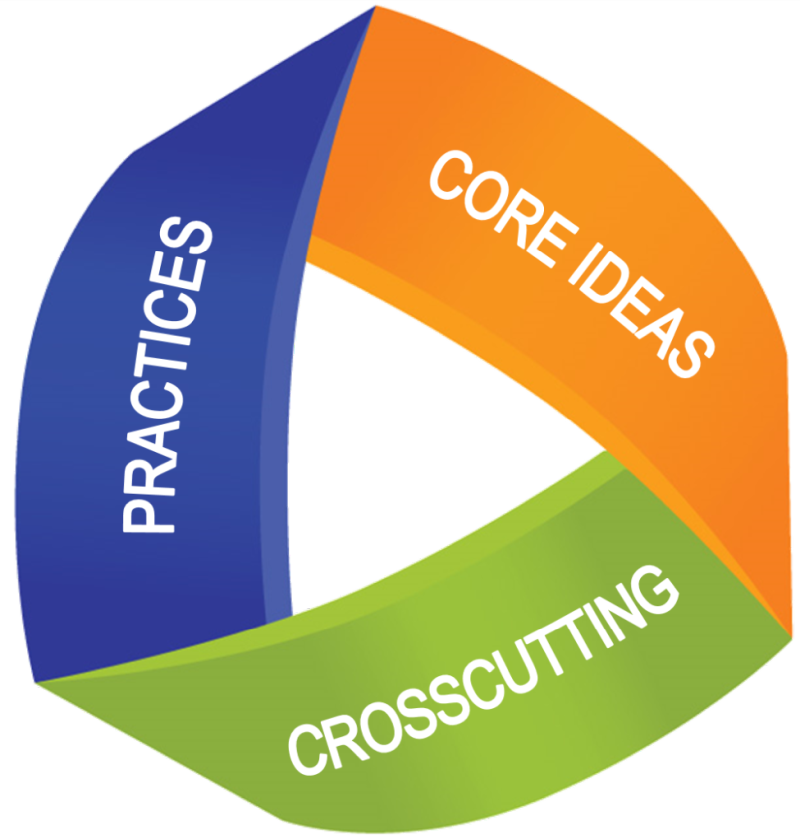
Within the Next Generation Science Standards (NGSS), there are three distinct and equally important dimensions to learning science. These dimensions are combined to form each standard - or performance expectation - and each dimension works with the other two to help students build a cohesive understanding of science over time. The three dimensions are:
This three-dimensional approach to K-12 science instruction represents a significant transition from previous state standards. That's why effective implementation demands a great deal of collaboration and patience among states, districts, schools, teachers, and students.
Thoughtful and coordinated approaches to implementation will enable educators to inspire future generations of scientifically literate students. That is the vision of the NGSS.
Science - and therefore science education - is central to the lives of all Americans.
A high-quality science education means that students will develop an in-depth understanding of content and develop key skills - communication, collaboration, inquiry, problem solving, and flexibility - that will serve them throughout their educational and professional lives.
To date, almost all states, the District of Columbia, and most U.S. Territories have adopted the Next Generation Science Standards or locally generated standards similar to NGSS.
The Next Generation Science Standards, or a local version of them, have not been fully implemented in all of those areas.
Why not?
Need more info about three dimensional learning?
https://nextgenscience.org provides a range of high-quality resources that empower educators, administrators, parents, and the general public to help bring this vision to life.
Need NGSS-based lesson ideas?
Check out More Lessons from the Sky, the SEA Lesson Plan Library containing 40 lesson modules for grades K-12. All are based on Next Generation Science Standards and all are free to use and adapt to the needs of your students, your curriculum, and your classroom situation.
Need to talk? Have questions, comments, ideas to share?
You are invited to the SEA Forum at https://SEAForum.SatEd.org -- a safe, online discussion environment for professional educators and those interested in near-space technologies.
[ Back to Top ]
More Lessons From the Sky, the SEA Lesson Plan Library houses lesson modules and supplemental resource materials for grades K-12. Each lesson is based on Next Generation Science Standards. A full description of the format of each module is found HERE.
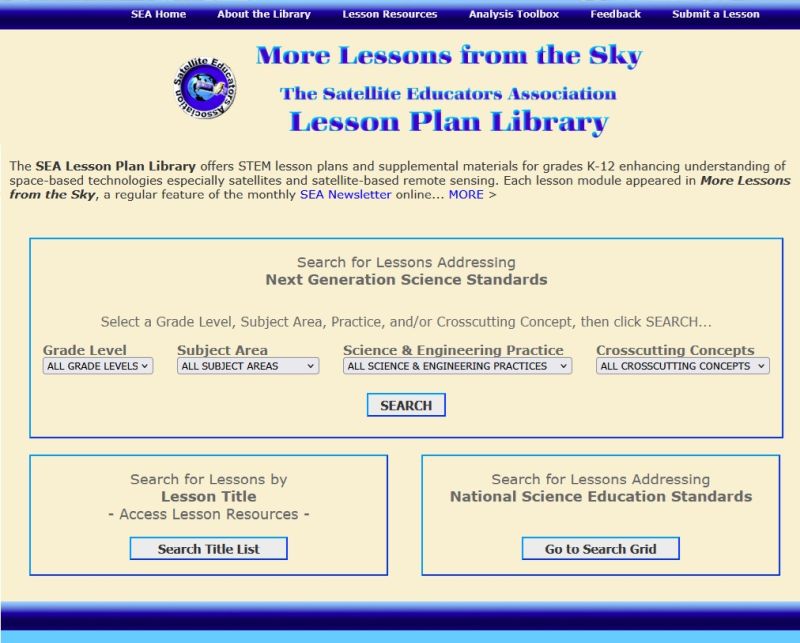
To find needed lessons, use search filters to sort by grade level, subject area, Science and Engineering Practice, and/or Crosscutting Concept. Alternatively, the lessons are also listed alphabetically by title to enable users to quickly find downloadable resources for a specific lesson title. Many of the lesson modules are also keyed to National Science Education Standards -- they can be found using a special search grid. Complete directions for using the search tools are found HERE.
Visit the SEA Lesson Plan Library anytime at https://lessonlibrary.SatEd.org.
[ Back to Top ]


How's the weather today? Is it the same as yesterday? Is it the same where your friend lives in a distant city? Will it be different tomorrow?
In this lesson, learners describe weather all over the world. After exploring causes of weather patterns, they will describe how weather in one location helps predict the weather in related areas.
Teams of learners study, chart, and write about the weather and its effects on a particular city, for a month. The team constructs a multimedia presentation of its findings. The class constructs a final project that uses and merges the teams' findings to demonstrate weather patterns around the world.
| Grade Level: | 3-5 |
| Time Requirement: | A few minutes each day for a month, then 2-3 hours |
| Prerequisites: | None |
| Relevant Disciplines: | Physical, Life, Earth & Space Sciences, Geography |
| Additional Resources Available: | Yes |
Standards Addressed
Next Generation Science Standards performance expectations incorporate core ideas, science and engineering practices, and cross-cutting concepts. Find more information about this lesson and these standards HERE.
| 3-ESS2-1 - | Represent data in tables and graphical displays to describe typical weather conditions expected during a particular season. |
| 4-ESS3-2 - | Generate and compare multiple solutions to reduce the impacts of natural Earth processes on humans. |
| 5-ESS2-1 - | Develop a model using an example to describe ways in which the geosphere, biosphere, hydrosphere, and/or atmosphere interact. |
[ Back to Top ]
Share your satellite-based lesson ideas with the teaching community.
Send us a complete lesson plan, or simply suggest a lesson idea. If you found the idea online, please share the source as well. The lesson can be about anything that helps connect learners with satellite-based technology - any grade level K-12 - any STEM subject area including geography.
Satellite-technology includes any part of the science, math, engineering, or technology of satellites, rockets, small-format satellites, and remote sensing instruments as well as the use of any environmental satellite data to explore questions related to aspects of global change and local impacts in the long term, short term, and catastrophic time frames. Of special interest are lessons providing opportunities for learners to inquire, experiment, and apply mathematics.
Perhaps you designed a lesson yourself - we will happily prepare it for future publication in More Lessons from the Sky and inclusion in the SEA's online Lesson Plan Library with full credit to the originating author(s). Perhaps you found a worthy lesson plan published elsewhere - we will do the research for possible inclusion in a lesson plan spotlight. In either case, you will receive full credit for developing and/or bringing the lesson to the attention of the teaching community. Don't forget to share your insights if you tried the lesson with students.
Please share your ideas at SEA.Librarian@SatEd.org.
[ Back to Top ]
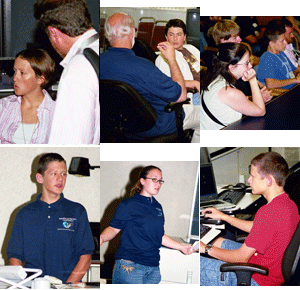
M.Y. S.P.A.C.E. Team students at work

This edition of the SEA Newsletter was produced in HTML5.
It is best viewed with most recent updates of Firefox, Edge, Chrome, Opera, or Safari.
©Satellite Educators Association, Inc. (SEA) https://SatEd.org SEA.Newsletter@SatEd.org
Satellite Educators Association, Inc. is a 501(c)(3) non-profit educational organization to which donations
are tax deductible.
The SEA Newsletter is published quarterly in March, June, September, and December.
The SEA Newsletter is published on-line and available at no cost.
SEA terms, conditions, policies, and contact information are detailed HERE.
Unless otherwise listed, all photo and image credits are the authors of the articles.
Any opinons expressed in this Newsletter are those of the authors
and not necessarily those of the Satellite Educators Association, Inc.
or any of its officers, members, or representatives.
Many SEA Newsletter items contain third-party links to sites not governed by Satellite
Educators Association, Inc. The viewer is cautioned to be aware of the terms of use and
privacy policies for those third-party sites.
Like what you see?
SCAN or CLICK the QR Code
to help SEA carry on
with a donation of time, talent,
and/or financial support.
Thank you.