OUR VISION
The world's finest educators supporting science, technology, engineering, and math (STEM) learning for pre-kindergarten to post-graduate students using real-world applications from satellites and satellite data.
OUR MISSION
To enhance the education environment to excite students about science, technology, engineering, and math through space-based technology -- satellites and satellite data.

Rob Lowe

Patriotism is a fierce love for the nation’s soul - its land, its people, its core, coupled with a burning contempt for a government that fails to reflect it. It’s a raw, rebellious spin: distrusting the system while cherishing the essence of the nation, with historical echoes like the American revolutionaries who loved their colonies but despised the crown.
Njia Kihia

TABLE OF CONTENTS
Click a RED link to view article
ASSOCIATION NEWS
PRESIDENT'S CORNER
EARTH SYSTEM SCIENCE
JOHN'S JOURNEY
SATELLITES with Ed
STEVE'S SPACE
A LOOK BACK
SATELLITES
ACCESS
ANALYZE
APPLY
IN THE NEWS
CAREER SPOTLIGHT
FOR TEACHERS
MORE LESSONS FROM THE SKY

September 1, 2025
In this issue, the top stories are the SmallSat Education Conference in October and Remembering Hurricane Katrina.
ASSOCIATION NEWS encourages all to attend the SmallSat Education Conference in October, summarizes the annual SEA Meeting in July, and offers new opportunities on SEA's Web site.
The PRESIDENT'S CORNER observes sea surface temperature changes in the UK; EARTH SYSTEM SCIENCE shares NOAA's updated predictions for an above-normal Atlantic hurricane season; JOHN'S JOURNEY explores SEA's role in satellite education; SATELLITES WITH ED reviews APT history and says "Farewell;" STEVE'S SPACE compares the space age to the digital age.
A LOOK BACK invites readers to remember August 29, 2005 when Hurricane Katrina made landfall in New Orleans. Resources sites are listed for more about the impact of the storm in 2005 and the 20 years since.
SATELLITES describes the new space weather observatory and remembers the historical legacy of the decommissioned NOAA POES satellite program.
ACCESS includes a deeper look at Category 5 Hurricane Erin; new data access for wildfire smoke and air quality; and looks at how NOAA preserves data records.
ANALYZE tells of the world's longest lightning flash; highlights harmonizing Landsat and Sentinel-2 data to improve imagery; and describes the process of mapping stellar "polka dots."
APPLY presents climate change through 70 years of ocean heat content data; examines the use of AI in new fire system technology; and looks at NOAA satellites helping safeguard Alaska's fisheries.
IN THE NEWS reports new imagery combining Australia Telescope Compact Array with X-ray data from NASA's Chandra satellite; and Trump's administration stripping ocean and air pollution monitoring from the next-generation of weather satellites.
A CAREER SPOTLIGHT features an interview with a citizen scientist turned astronaut.
FOR TEACHERS lists bountiful resources for starting a new school year using activities and events from SEA, SmallSat Education Conference, NASA's Student Launch Challenge, NOAA's Teaching Climate information and materials access, and the updated Back to School With NOAA.
MORE LESSONS FROM THE SKY presents the latest update (June 2024) of the Tracking Hurricane Sandy lesson module in which students grades 4-9 compare Hurricane Sandy (2012) with Hurricane Katrina (2005) using cooperative learning group strategies involving online research and using ImageJ and ArcGIS Online.
Enjoy!
--Editor

[ Back to Top ]

Have you registered for the SmallSat Education Conference yet? It's not too late! Registration is open online at https://www.smallsateducation.org
The 2024 SmallSat Education Conference will take place in The Center for Space Education at Kennecy Space Center in Florida, October 25-26. The conference is focused on educational opportunities and curricula for community college, high school and middle school faculty and students. Registration rates are inexpensive and worth every penny. Register now at the above link.
More information about each keynote speaker can be found on the conference Web site at https://www.smallsateducation.org.
The SmallSat Education Conference provides hands-on training for educators and students, networking opportunities with industry experts, and insights from exhibitors and vendors. Managed by Aerospace and Innovation Academy, The Wolfpack CubeSat Development Team, and BLUECUBE Aerospace, the event engages attendees with CubeSats, ThinSats, and High-Altitude Balloon programs, offering authentic experiences to help bring space education to the classroom.
Goddard 100 Student Contests
The SmallSat Education Conference and the National Space Society (NSS) have joined forces to honor the legacy of Robert Goddard, the father of modern rocketry. In celebration of the 100th anniversary of that first modern rocket flight, students are invited to participate in a series of exciting contests that inspire creativity, innovation, and a passion for the future of space exploration.
Learn more HERE.
Small Sat Education Innovators Challenge
We are excited to announce an Educator Contest designed to inspire middle and high school educators to integrate authentic aerospace experiences into their curricula. In partnership with the SmallSat Education Conference, the Wolfpack CubeSat Development Team, and the American Institute of Aeronautics and Astronautics, you are invited to submit your innovative lesson plans, challenges, activities, or demonstrations that incorporate content related to incorporating high altitude balloons, ThinSats, CubeSats, and PocketQubes in the classrooms of middle and high school students. A total of $5,000 in prizes will be awarded to the challenge winners.
Learn more HERE.
Challenger Center Educator Contest
Educators may earn $1,500 credit towards any in-person or virtual Challenger Center programming. 4th–8th grade educators are encouraged to submit a short essay (400 words max.) on how you would use the award to benefit your students. The award must be used in the 2025–2026 school year. Include details for implementation. Must attend the SmallSat Education Conference to win. Deadline to enter is October 15, 2025. Full details may be found on the entry form.
Learn more HERE.
From 1988 to 2022, the Satellite Educators Association (SEA) produced the extraordinary Satellites & Education Conference in Pennsylvania and California. After 35 years, the SEA adopted the SmallSat Education Conference, now in its fourth year, in Florida as its annual conference focus in lieu of continuing to produce the Satellites & Education Conference. At the SEA annual meeting on July 31, members agreed on the importance of exploring and developing closer relations with the SmallSat Education Conference.
Don't miss it this year...the SmallSat Education Conference at the Kennedy Space Center, October 25-26, 2025.
[ Back to Top ]
By Pete Arvedson, SEA Newsletter Editor, Summarizing the minutes of the July 31, 2025 SEA Meeting
Members in good standing of the Satellite Educators Association (SEA) met on ZOOM on July 31, 2025, for SEA's annual business meeting. After the usual reports of the Association, members engaged in a number of pertinent discussions.
The By-Laws Committee formed after the 2024 SEA meeting offered revised By-Laws for review and approval. For the most part, the revised By-Laws eliminated reference to an annual Satellites & Education Conference. It was felt this was necessary to allow the Association to support the SmallSat Education Conference or another similar conference in lieu of producing an annual Satellites & Education Conference. The revised By-Laws were approved. The By-Laws are posted for viewing in the Member Services area of SatEd.org.
Since the general philosophies of the SmallSat Education Conference and the Satellites & Education Conference were substantially the same, closer collaboration between SEA and the SmallSat Education Conference was discussed. Here are some of the key points of the discussion:
The SEA members decided to continue financial support for the SmallSat Education Conference this year while developing a closer alliance with its producing organization. The Executive Committee was charged with scheduling another membership meeting within the next six months to continue such discussion.
Kevin Simmons, producer of the SmallSat Education Conference, attended the meeting. Kevin also produces a regular podcast in which people share their interest in satellites and using satellite-base data. He has invited any SEA Member or person interested in using satellite data to interview for a podcast. John Moore, long-time SEA Member and Executive Director of the Institute for Earth Observations in New Jersey, has agreed to coordinate potential interviewees. All interested persons can initially make their interests known by contacting SEA.Web@SatEd.org, or using the SEA Contact Form, or posting a request in the SEA Forum.
[ Back to Top ]
From the SEA Web Manager
A new online SEA Forum is now available for interested people to post questions and comments. This online bulletin board service is intended to enhance communications between SEA members and anyone else interested in topics related to SEA's Vision and Mission. The SEA Forum is open to students, educators both formal and informal, other professionals, hobbyists, and you.
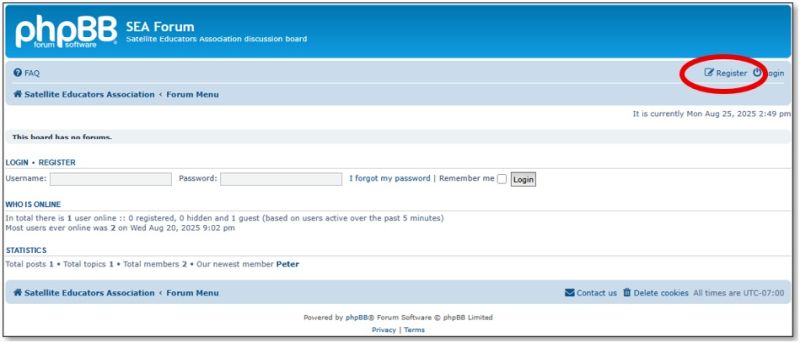
To get started in the SEA Forum, access SEA Forum from the SatEd.org home page and register as a new user. Once registered, simply log in with your registered user name and password.
To get the conversation started, the SEA Newsletter editor has requested feedback regarding the newsletter. All constructive questions and comments are welcome. Over time, new discussion threads and topics are expected to emerge.
Registered users can post questions, comments, answers. They can even communicate with each other via email.
Of course, all SEA Forum users are expected to remain courteous and professional by adhering to the posted guidelines found on the Forum and HERE. Bulletin board posts will be monitored by a moderator. Inappropriate posts will be edited or deleted. Repeat offenders will be banned from the SEA Forum on a temporary or permanent basis.
You are invited to join the conversation today. Become a registered user on the SEA Forum.
[ Back to Top ]
From the SEA Web Manager
To Space..., a collection of articles from the SEA Newsletter, have been added to the Using Satellites in Education section of SatEd.org. Space Travel Basics is the collection of articles by Steve Mills; Satellites & More contains the collected articles by Ed Murashie.
"It's nice to have these articles all in one place instead of searching for them one at a time in the SEA Newsletter archive," said one newsletter reader. Past issues of the SEA Newsletter are available for viewing and downloading using the Prior Editions link found at the top of each newsletter. Now they are truly "all in one place."
Just look for the To Space... link on the Using Satellites in Education home page. There is also an anthology link on the "Environmental Satellites 101" page.
[ Back to Top ]
From Fredric Raab, Educator, College of the Desert, California; Licensed radio amateur, KK6NOW
SEA Member Fredric Raab will present Bridging Orbit and Classroom: SatNOGS and CubeSat Activities at the 43rd Annual AMSAT Space Symposium & Annual General Meeting, October 16-19, 2025 in Phoenix, Arizona.
Raab describes his presentation:
"This presentation addresses the challenge of interpreting satellite telemetry data and relating it to real-world satellite behavior. It introduces a powerful synergy between SatNOGS, a global open-source network offering free access to over 12 million real satellite observations, and the CubeSatSim, AMSAT's low-cost satellite emulator."
SatNOGS enables students to "adopt" on-orbit CubeSats, providing the experience of being a satellite operator by scheduling downlinks and monitoring dashboards. To overcome the difficulty in interpreting this real-world telemetry, the CubeSatSim offers a hands-on, controlled environment. Students manipulate the CubeSatSim to directly understand how sensor data reflects solar panel performance, orientation, spin rates, and radio communications. This practical experience directly enhances their ability to interpret SatNOGS dashboards, demystifying the conversion of "waterfall signals into bits" and "bits into data." Together, SatNOGS and CubeSatSim provide both real-world data and practical understanding of telemetry data.
AMSAT (the Radio Amateur Satellite Corporation) is a non-profit educational organization founded in 1961. For more than 50 years, AMSAT has placed satellites in low Earth orbit enabling voice communications between amateur radio operators. Since 2015, four of those have been CubeSats, and the AMSAT radio designs and protocols for those CubeSats have been adopted by numerous educational CubeSats currently in orbit.
AMSAT developed the CubeSat Simulator (CubeSatSim)to provide students with hands-on, classroom experience receiving and interpreting operational telemetry data using the same radio communications methods employed by CubeSats. AMSAT makes simulators and ground stations available for loan to teachers and other educational groups accompanied by instructions for classroom activities.
Conference information and much more about AMSAT can be found at https://www.amsat.org/43rd-amsat-space-symposium-and-annual-general-meeting/#.
[ Back to Top ]


By Simon Cracknell, President, Satellite Educators Association
This summer, I took my family to Cornwall, in south west England, known for the best surfing conditions in the country, and, when we are lucky, the weather rivals that of popular European destinations such as Greece, Spain, and Southern France. However, despite the warming Gulf Stream conditions, our latitude gives us a lower sea surface temperature (SST). Given those lower temperatures, I have always chosen to use a wetsuit, and it is unusual to see any hardy souls not feeling the same way.
Despite experiencing the south west coastline’s cold waters for the best part of 20 years, it has become noticeable that the water is getting warmer. This was best evidenced by my lack of a wetsuit and far less discomfort linked to chilly water. Another thing that has been noticed is the increase in far larger jellyfish in the shallow waters and near shore. While some actively thrive in colder waters, we have never noticed so many as we have in the last 5 years and even those figures have been eclipsed this year. We know these Cnidarians respond quickly to even small changes in climate, perhaps indicating a climate in a state of flux. Species include the distinctive Compass and Moon jellyfish (Chrysaora hysocella and Aurelia aurita, respectively). Although they are known to be 'locals,' they were never so noticeable as now. Although this is only empirical data observed by my son and me over a week, average size is greater, and spawn rate does appear to be higher. This is corroborated by friends and family over longer periods of time.
More widely, we have been identifying other marine species that are definitely not common in UK waters. Anglers from around the UK have reported sightings of Bluefin Tuna (Thunnus thynnus) not common at all in our waters. Bluefin tuna numbers have been building over the past decade in south-west England for a number of reasons including warmer waters and better management of their populations. We do seem to be seeing a shift of cooler water species moving north in general. The question appears to be whether a wider global warming trend is responsible for this short term change in where some species can be found.
Satellites are equipped with an array of instruments, such as infrared and microwave radiometers, that can measure sea surface temperature to varying depths, penetrating cloud cover and across wider swaths with increasingly higher resolution. The opportunity to measure the changes in SST over time has afforded us a window of opportunity to address the threat of global warming, promoting discussion. However, in the classroom, this data can come alive, allowing teachers to develop a deeper understanding of climate related phenomenon in young people. The National Curriculum and exam specifications in Science and Geography in the UK promote a core set of themes that need to be studied. These are approached in a number of different ways producing significant amounts of data. The wide range of data gathered allows us to complete inquiry-based studies, often starting with observations and a scientific method used to reach reasonable conclusions.
[ Back to Top ]

By Ron Gird, Meteorologist and former Satellite/Spaceflight and Outreach Program Manager for the National Weather Service
From NOAA News & Features at https://www.noaa.gov/news-release/prediction-remains-on-track-for-above-normal-atlantic-hurricane-season
August 7, 2025
Forecasters from NOAA’s National Weather Service updated the number of expected named storms to 13-18 (with winds of 39 mph or greater), of which 5-9 could become hurricanes (winds of 74 mph or greater), including 2-5 major hurricanes (winds of 111 mph or greater).
The adjusted ranges are for the entire season from June 1 though November 30, and are inclusive of the four named tropical storms that have already formed. In the Atlantic basin, a typical hurricane season will yield 14 named storms, of which seven become hurricanes and three become major hurricanes.
[ Back to Top ]


By John D. Moore, Executive Director, Institute for Earth Observations at Palmyra Cove, New Jersey
Over the decades, two qualities have defined the Satellite Educators Association (SEA): curiosity and innovation. Longevity brings perspective and wisdom, but the thrill of discovering something new never fades.
I still recall Helen Martin exploring ways to bring NOAA satellite imagery directly into her classroom, or my 1987 effort setting up a GOES satellite dish before schools had personal computers or Internet access. Colleagues like Pete and Paula Arvedson and Duane Laursen would travel across the country simply to contribute. Why would we do this? Each of us shared a common mission: opening doors for students to explore the role of Satellites in Education. Today, SEA continues that legacy. I am grateful to Kevin Simmons for inviting SEA onto the Let’s Go To Space: BLUE-SKY Learning Podcast, offering a platform to share our stories and inspire the next generation of educators and learners. Passing knowledge is not enough — we must also highlight the dedication and innovation of the educators, scientists, and leaders who built the foundation students now stand on.
The A3SatPQ Emulator will be introduced soon, building on the success of the A3Sat CubeSat v.2 Emulator which expanded precollege satellite education opportunities. Developed by our team — John Moore, Max Friedman, Jin Kang, Ph.D., Mike Jabot, Ph.D., Sriram Elango, and TSgt Scott Seal — the emulator gives students authentic experience in satellite design, systems integration, data analysis, and mission planning.
Dr. Kang and I recently presented the A3SatPQ at the SmallSat Conference in Utah. In the coming months, we will unveil the prototype at the SmallSat Education Conference in Florida and present at AGU, AMS, and the AIAA SciTech Conference. This project links students directly to workforce-ready STEM and aerospace skills while reflecting SEA’s mission of hands-on, curiosity-driven education.
The SmallSat Education Conference (25–26 October 2025, Center for Space Education, Kennedy Space Center Visitor Complex, with a virtual option) offers:

SEA’s sponsorship highlights the natural alignment of our mission with the conference:
In short, the conference is a continuation of SEA’s mission: from looking at satellites to building, testing, and exploring them.
A highlight of the SmallSat Education Conference will be Dr. Mike Jabot’s Workshop introducing satellite technologies and concepts that culminate in projects like the A3SatPQ Emulator. His "spherical cow" approach uses simplified models to guide students step by step, connecting theory to authentic aerospace practice. This type of approach highlights the connections between SEA’s mission and objectives, and the current transitions taking place as the SmallSat Education Conference continues to evolve making SEA’s contributions invaluable.
SEA is a bridge linking the early excitement of classroom satellite projects to today’s advanced small satellite technologies. Passing along knowledge is only part of our responsibility; engaging students with hands-on experiences prepares them for tomorrow’s challenges.
Remember -- you can teach anything with satellites.
Stay safe … stay well!
For now, I’m John… and this is my journey.
[ Back to Top ]

By Edward Murashie, President, ProEngineered Solutions
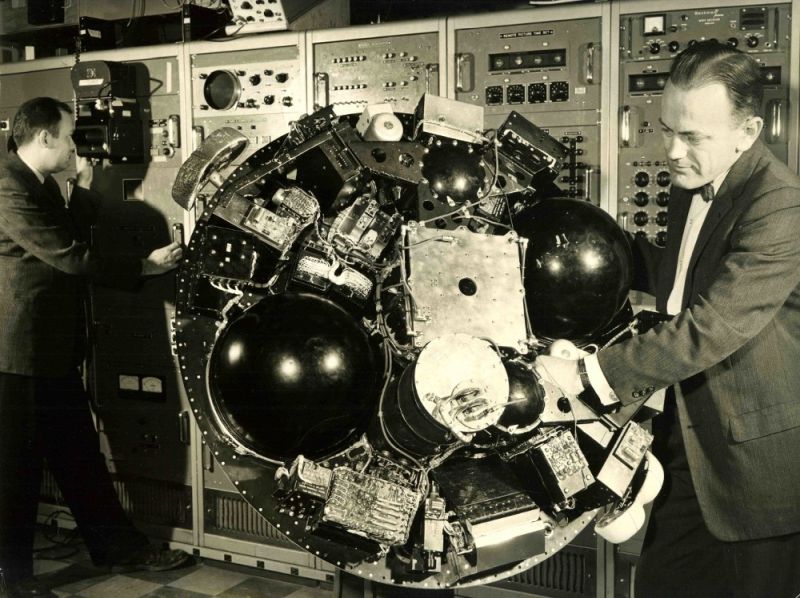
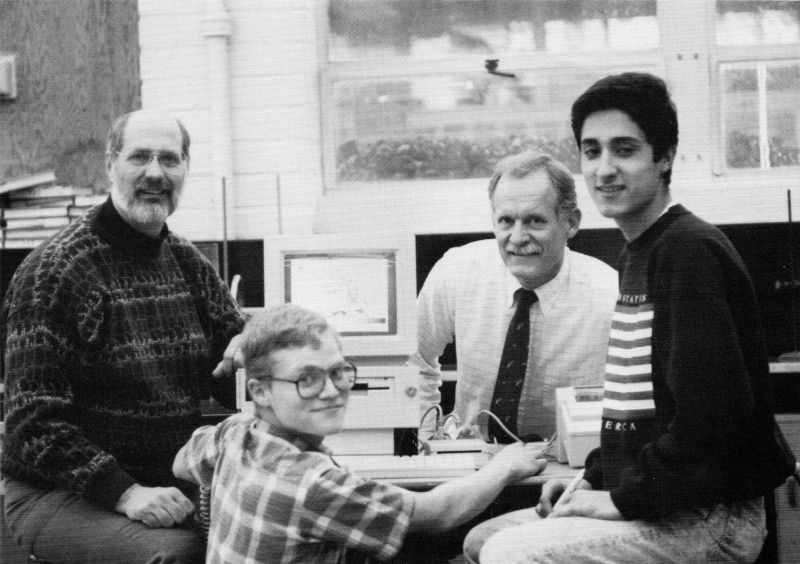
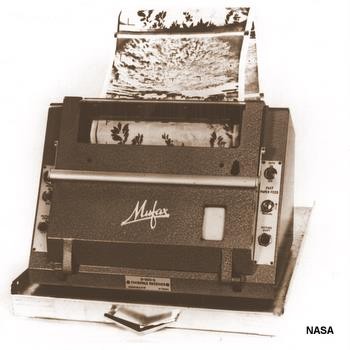
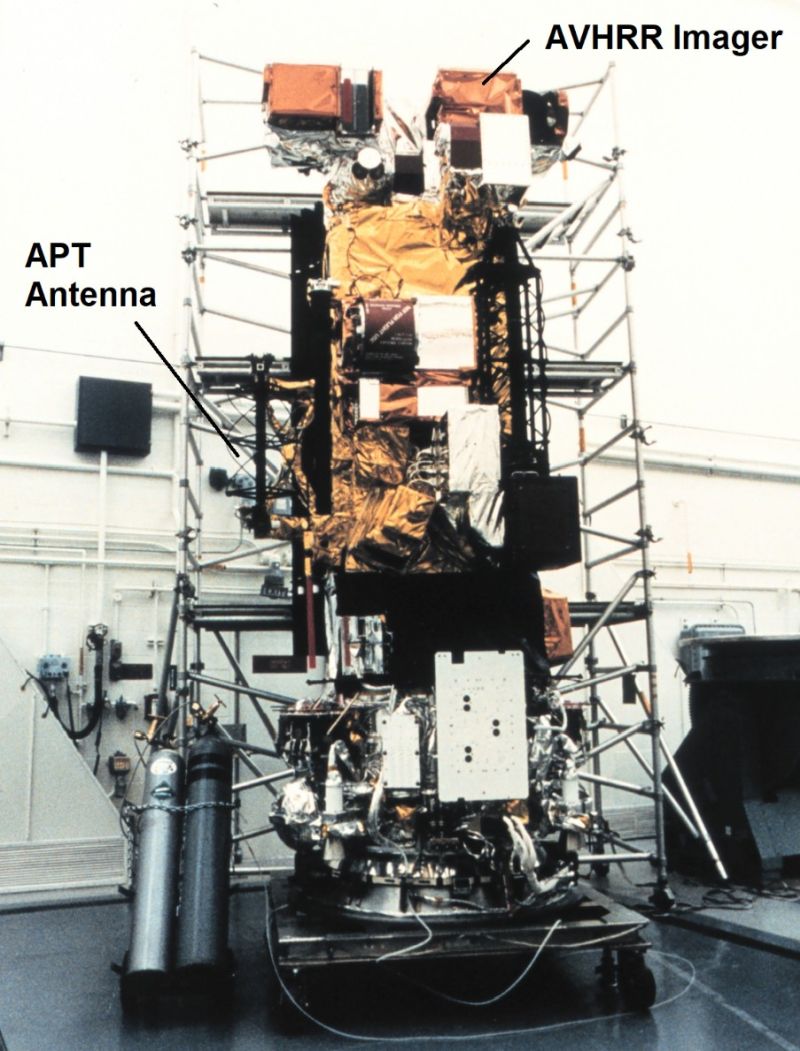
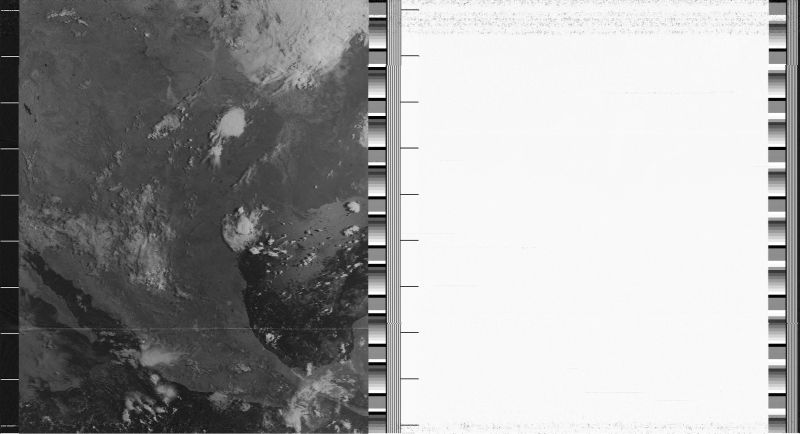
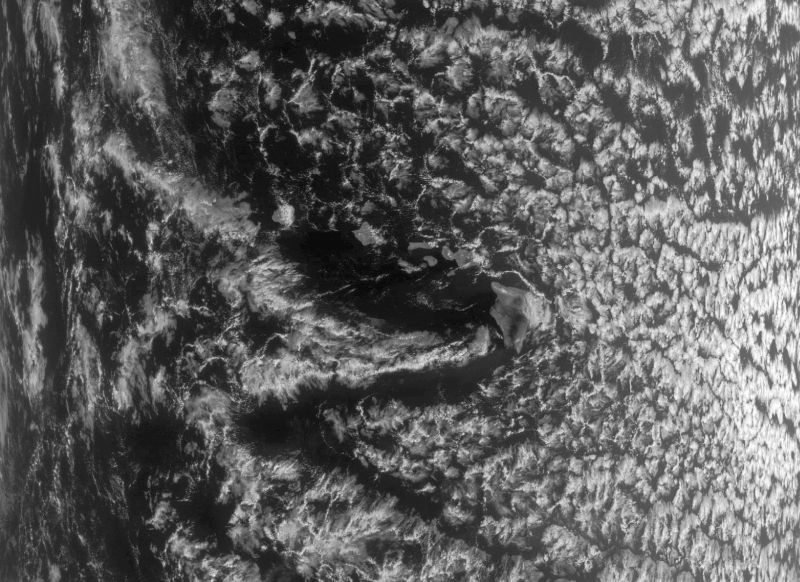
Now that the last weather satellite carrying APT has been decommissioned, let’s look at how it allowed us to go from needing a large antenna and racks of electronic equipment (shown in the first photo below) to receiving images in the classroom shown in second photo below). APT is an acronym for Automatic Picture Transmission which is a type of analog image transmission.
The United States' first dedicated weather satellite was Television Infrared Observation Satellite, or simply TIROS, was launched on April 1, 1960.
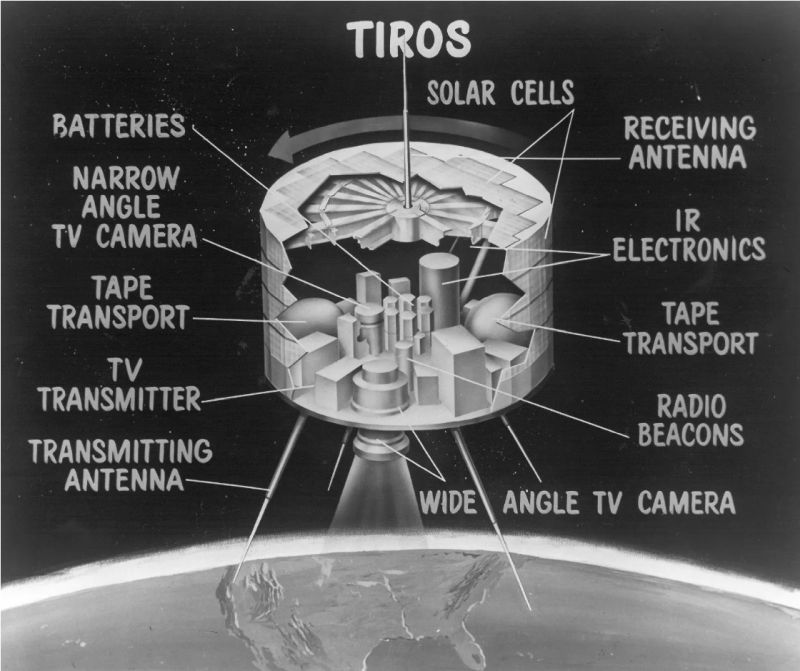
The first seven TIROS satellites carried two vidicon tube cameras and could either record their signals to an onboard magnetic tape or transmit them to the two primary Command and Data Acquisition Stations (CDAS) in Fort Monmouth, New Jersey or Kaena Point, Hawaii, or to backup stations in Cape Canaveral, Florida or Princeton, New Jersey. More CDA stations were added later.

To receive an image, a CDAS transmitted a signal to the satellite to command it to start sending a direct or tape recorded signal and then receive the images during the six to twelve minutes that the satellite was in view. The received signal was recorded on tape and displayed on a Cathode Ray Tube which was photographed by a camera as shown by the man on the left in topmost photo above. The film was sent to the Naval Photo-Interpretation Center in Washington DC where copies were made and sent to research and meteorological agencies. Backup images were also made, interpreted at the CDAS, and sent via FAX to the US Weather Bureau Meteorological Satellite Laboratory at Suitland, Maryland. This was not a quick operation and required communications to and from the satellite.
The original meteorological satellite plan was to use TIROS as an initial research and development satellite and use the follow-on NIMBUS satellite series as the operational satellite. Unfortunately due to the NIMBUS satellites complexity and cost overruns, TIROS became the operational satellite with the follow-on provided by the mission series Environmental Science Services Administration (ESSA) 1-9.
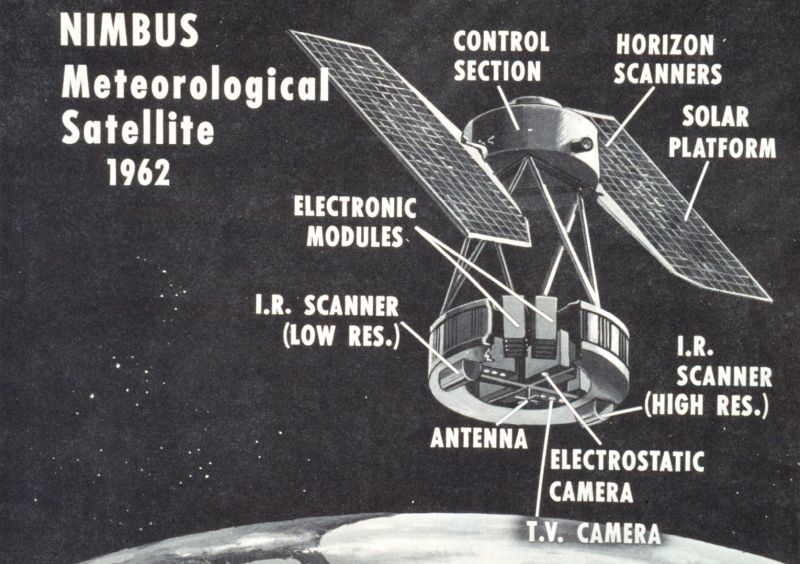
One of the NIMBUS mission’s early objectives was to develop a camera that would operate autonomously, image the Earth, and send the images to an inexpensive ground station. This would allow for more receiving stations that would have immediate access to local satellite images and became known as Automatic Picture Transmission or APT.
As a test, APT first flew on TIROS-8 launched in 1963. It later flew on certain ESSA and ITOS launches. And finally, starting in 1978, it flew on all TIROS-N, Advance TIROS-N, and POES missions. The APT format changed from single images to continuous images as the satellite’s camera or radiometer imager changed over generations. But it has always remained a 2400 Hertz tone that is amplitude modulated, meaning the louder the tone the lighter that part of the image, by the image and synchronization information. This made for simple image reception.
Throughout the years these stations could always be relatively simple. In the early days it could be as simple as a fixed VHF antenna with a preamplifier going to a modified FM receiver and a Muirhead D900S facsimile. Today it's as simple as a preamp with a USB software defined radio dongle plugged into a PC running receiving and decoding programs like SDR# and WXTOIMG. These types of low-cost stations made use possible in a variety of settings, like amateur radio stations and school classrooms, located in diverse locales ranging from the United States to remote islands and ships. The World Meteorological Organization in 2004 listed over 5000 registered APT stations, although the experts today suggest the number could be in the tens of thousands since registering a station is not a requirement and the cost of a station is less than $500.
The POES missions, NOAA-15 through 19 launched between 1998 and 2009, were designed for a minimum two year operational life but many operated went well past those lifespans. Recently, NOAA’s plan was to decommission the last two surviving satellites, NOAA-15 first and NOAA-19, a week later. But as one blogger stated: "NOAA-19 went out on its own terms" when its battery died before being decommissioned, leaving NOAA-15 (photo above) as the last satellite transmitting APT. On August 19, 2025, over 27 years since its launch, NOAA-15 was decommissioned. I received the image below at 7AM local time, on 137.62MHz, and by the next orbit it was off the air.
Farewell APT.
So is that the end of the story? Do I take my SDR and antenna and put it away for good? No!
Russian Meteor M N2-3 and Meteor M N2-4 transmit digital Low Resolution Picture Transmission (LRPT) on 137.9MHz or 137.1MHz and can be received with the same APT antenna, preamp, SDR, and PC using free software. They were launched in 2023 and 2024, respectively, and the current plan is for four more with the last one to be launched in 2033. Watch for a future article that will explain how you can receive and decode their images.
[ Back to Top ]


By Steve Mills, Retired Systems Engineering Scientist; owner and Chief Engineer of Polymath Geo
Historians generally agree that the Space Age is the period beginning in 1957 with the launch into orbit of Sputnik 1. Another "Age" that also began in the mid-twentieth century is the Digital Age (aka Information Age, Computer Age or Third Industrial Revolution). Historians generally peg its start to 1947, with the invention of the transistor at American Telephone & Telegraph (AT&T) Bell Labs. In previous articles I described the powerful rockets that lift satellites into space. But as important as a gigantic rocket is to the space mission, so too is the microscopic circuitry needed for communications and data processing. In many ways it was the union of rocket science and digital science that birthed the Space Age.
I will first briefly review the historic development of electrical and electronic devices. In 1800 Italian physicist Alessandro Volta invented the electrochemical battery, the voltaic pile. In 1824 British scientist William Sturgeon invented the electromagnet. These two inventions soon led to the development of the electric solenoid, and the electric motor both which convert electric energy into mechanical energy. It was also found that when an electric motor is rotated using mechanical power (such as a water mill or windmill) that it will generate electricity and that this electricity can be used to recharge batteries.
To fully understand electricity and magnetism, and how they relate to one another, in 1864 Scottish mathematical physicist James Maxwell published a comprehensive theory of electromagnetism. His theory, now called Maxwell’s Equations, predicted that coupled electric and magnetic fields travel through space as electromagnetic waves. He also theorized that light is actually electromagnetic waves of a very short wavelength. It was not until 1887 that German Physicist Heinrich Hertz conducted experiments that would prove that Maxwell's electromagnetic waves are in fact real, and these waves were called radio waves.
In 1894, Italian electrical engineer Guglielmo Marconi developed a wireless telegraph system using radio waves. Within the next decade engineers began experimenting with wireless voice communication. By the 1920’s governments began licensing radio stations that would broadcast an audio signal over a large area. Also, during this same period the telephone came into more common use, and eventually replaced the telegraph as the primary means of long-distance communication. In the 1930’s broadcast television began in many countries, though it was a novelty or experimental. After World War II broadcast television became much more common throughout most of the world.
This brings to the start of the Digital Age. As I mentioned earlier, it began with the invention of the transistor at AT&T's Bell Labs in 1947 although the complete conversion to commercial digital electronics would not occur until the first decade of the 20th century. You may wonder why a telephone company wanted to invent a transistor. There were at least two reasons:
Although Bell Labs was not a computer company, there were computer companies such as IBM and Remington Rand that took immediate interest in the invention of the transistor. Like phone routing electronics, computer electronics in those days also used vacuum tubes and electromagnetic switches.
Another under-appreciated Bell Lab Scientist was Claude Shannon, called the "father of information theory," who laid the foundations of the Information Age. He was the first to describe the use of Boolean algebra as essential to all digital electronic circuits and worked out the math to understand the limits of information bandwidth in the presence of electronic noise.
Within a few years of inventing the transistor, one of the Bell Lab inventors of the transistor, William Shockley, left to start Shockley Semiconductor Lab in in Mountain View, California. This was the beginning of what is now known as Silicon Valley. The metal–oxide–semiconductor field-effect transistor (MOSFET), was invented at Bell Labs between 1955 and 1960, and is today the most widely used transistor because it can be made as integrated circuits, where billions may be included in a memory chip or microprocessor.
Here the Space Age and the Digital Age converge. It could be argued that the United States won the Space Race to the moon, not because of its massive spending or because of inspirational speeches by President Kennedy, but rather because of its digital superiority. The Soviet Union also made huge expenditures on its Lunar program, and its leaders also made inspirational speeches. But from the start the USA was the undisputed leader of the Digital Age. While the USSR did seem to be ahead because of its more powerful rockets, it lacked the digital capability required for a moonshot. For Apollo 11, when the Eagle was landing on the Sea of Tranquility, it was being guided by a computer with MOSFET integrated circuits developed at Bell Labs, and it had the Apollo Guidance Computer Software developed at the MIT Instrumentation Laboratory led by computer scientist Margaret Hamilton.

Today we are so surrounded by digital information that we may fail to realize that the natural world is almost entirely analog. The sound we hear with our ears, the light we see with our eyes and the temperature we feel with our skin are all analog information. So, when you plug a headset into your electronic device, its computer must convert the analog signal from your microphone into a digital signal, and it must also convert the digital signal from sound output of the device into an analog signal that goes to your ear buds. Likewise, the job of your video screen is to convert a digital video image signal to an analog light intensity. If you have a touch sensitive screen, the device must convert the location and pressure of your fingers into a number. Whether an analog signal is from a light sensor (camera), sound sensor (microphone) or pressure sensor (piezo-electric), it produces an analog voltage or current. An analog to digital converter (ADC) produces a time series of numbers, that is, a digital signal.
Boolean algebra is the mathematics of logic based entirely on true or false, which can also be thought of as one or zero. Claude Shannon theorized that all computer functions could be reduced to Boolean algebra. Therefore, all digital information can be reduced to zero or one. This is also called binary math. A single binary digit is called a bit. A byte is a binary digit with eight bits. So 01001101 is a possible binary value for a byte. For the actual electrical signal, a one would be represented by a higher voltage and a zero by a lower voltage.
Alphanumeric characters are not analog information and are represented digitally using a code. An old code standard was ASCII which used 7 bits to represent 128 characters. For example, the binary number 0100100 represents the character “$”. However, 128 characters is insufficient for the many languages of the world. The most common code used today is UTF-8 which is now the standard for the internet.
UTF-8 is also the standard for most modern satellites, but setting digital standards continues to be a problem. Some satellite programs are decades old, and some newer programs adapt a standard from a heritage system. There are also different standards for representing numeric data. Integers may be 8, 16 or 32 bit. They may be unsigned or signed, meaning the first bit indicates whether the number is positive or negative. Or numbers may be floating point, meaning they contain an exponent (e.g. 1.234 x 10⁴). There are also some standards where the bits are read from least significant to most significant (called little-endian) rather than the opposite (called big endian). In some cases data packets contain headers that provide information on formats, but there is no uniform standard for headers. For imagery, one byte per pixel per color has become standard. One byte allows for 256 illumination levels from 0=black to 255=white.
This is not meant to be a tutorial on data formats but is rather intended to give a sense of the complexity of satellite digital data standards. If there is any good news it is that more recently satellite missions have more often adopted the same standards as the general computing industry. Sometimes it is dictated as a requirement by the government agency, but more often it is a recognition that satellite programs are increasingly dependent on commercial software, and are not a world unto themselves.
For an uncrewed satellite, mission control sends commands to the satellite instructing the spacecraft what to do, for example, to maneuver, fire a rocket, or turn a camera on or off. The satellite may also be queried about its status, for example, the temperatures of various components or the amount of power left in its battery or fuel for its rockets. This is called telemetry data. For most satellites orbiting the earth, much more data is being sent from satellite to earth than from earth to satellite. For example, for a weather satellite most of the data is the images of the earth’s weather. A communication satellite, however, is sending large quantities of data up to be retransmitted back down to earth.
To maximize the signal strength at ground receiving station, the satellite must point its transmitting dish directly toward the receiving dish on the ground, and the ground station requires a large dish to collect as much signal as possible. A geostationary satellite is not moving with respect to the ground so it can be transmitting data constantly to a single ground station. Low earth orbit satellites, however, are constantly moving with respect to the ground so they require a strategy to transmit data. Some missions save data in computer memory and then downlink the data during a short period when they are over the desired ground station. Other missions use several ground stations over an orbit, and then the data is sent from these stations over internet to a centralized mission control.
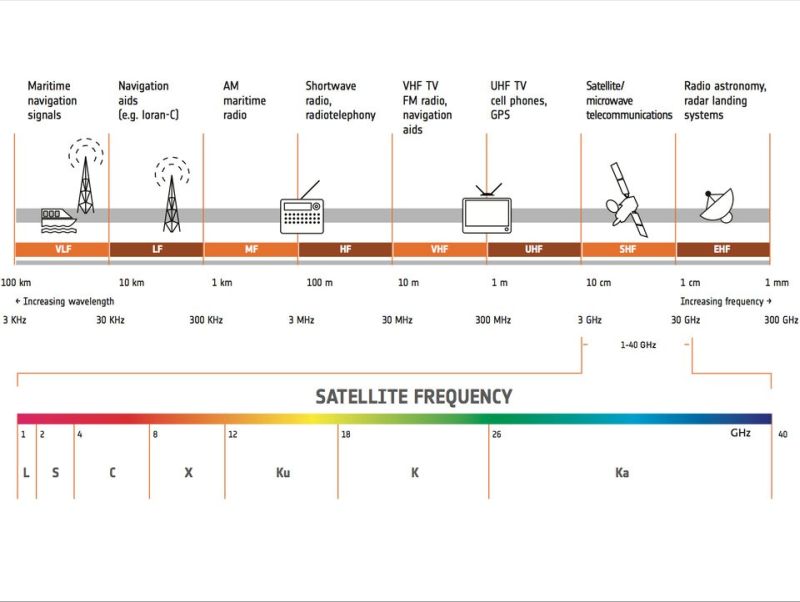
There is a range of frequencies between 1 and 40 GHz in the electromagnetic spectrum that are reserved for satellite communications. A satellite mission will usually need to determine what bands it needs and request permission from national and international agencies that regulate the use of these bands. With the many satellite frequency bands that can be used, names have been given so that they can be referred to easily.
The higher frequency bands typically have wider bandwidths but are more susceptible to degradation due to the absorption of signal by rain, snow or ice.
As satellite numbers increase, congestion has become a serious issue in the lower frequency bands. New methods are being investigated so that higher bands can be used. The table and graphic below show names and frequency ranges of various wavebands. The table gives a description and typical uses for these bands. In some cases, these bands are also used for terrestrial communications. Usually, satellite manufactures are required to prove that the satellite will not interfere with terrestrial communications.
| Band Name | Freq. Range (GHz) | Description | Typical Uses |
| L-band | 1-2 | It provides reliable, low-data-rate communications with excellent resistance to weather, which makes it ideal for mobile and safety-critical services. | GPS navigation, satellite phones (e.g., Inmarsat, Iridium), aviation tracking, and maritime communications. |
| S-band | 2-4 | It offers stable and resilient performance with good penetration through atmospheric conditions, often used for control links and mobile connectivity. | Telemetry, tracking and control (TT&C), mobile satellite communications, S-band payloads for aviation and rail safety, and multimedia delivery to handheld terminals. Used in deep space missions like the James Webb Space Telescope for real-time telemetry. |
| C-band | 4-8 | It is valued for its low rain fade and wide coverage, making it a dependable choice for large-scale communications infrastructure. | Satellite TV broadcasting, enterprise VSAT networks, long-distance telephony, and disaster recovery communications. |
| X-band | 8-12) | It is a protected, highly stable band primarily used by military and government users for secure and mission-critical operations. | Military satellite communications (MILSATCOM), radar imaging (SAR), battlefield data relay, and government TT&C. |
| Ku-band | 12-18 | It supports high-capacity services with smaller antennas and is widely used for mobility and consumer applications. | Satellite television, in-flight connectivity, maritime broadband, and commercial VSAT services. |
| K-band | 18-26 | It offers short-range satellite links, for data transfer and broadcasting. It is also used in short-range weather radar, as it is more stable in humid conditions. | Short-range, high-resolution, high-throughput satellite links for data transfer and broadcasting; law enforcement radars, collision avoidance systems in cars and surface movement radars for aircrafts and vehicles at airports. |
| Ka-band | 26-40 | It enables ultra-high-speed data transmission and massive capacity, ideal for broadband and cloud services, though sensitive to rain. | High-Throughput Satellite (HTS) internet, satellite-based 5G backhaul, cloud access, military communications, and enterprise broadband (including cell phones). |
In my next column I will look toward the future of space and attempt to separate science fact from science fiction. See you then!
[ Back to Top ]


An Op/Ed item by SEA Newsletter Staff
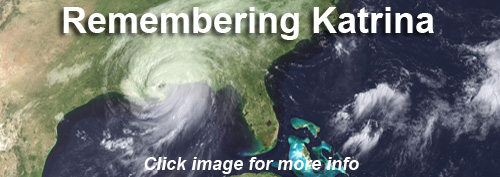
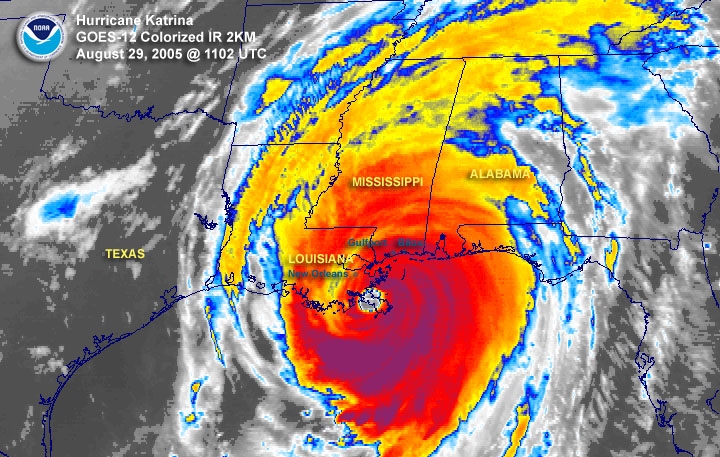
August 29, 2025
Twenty years ago today, Hurricane Katrina made landfall in Louisiana. The hurricane reached Category 5 on the Safir-Simpson Wind Scale (175 mph winds) in the Gulf before the eye reached the shoreline. When Katrina's eye hit land, winds were 135 mph (Category 4). Disaster response plans and preparations across the city were inadequate. The high winds drove storm surge that broke open levies and flooded large parts of New Orleans. Water level for some reached roof tops; some houses were simply swept away. An order to evacuate the city was given too late for most. Tens of thousands of survivors were corralled into the Superdome and the Convention Center without sufficient water, food, or appropriate sanitation facilities. Thousands more were trapped at home. The official death toll was 1,392 although some estimates run as high as 1,833. Damages were estimated at $125 billion (in 2005 US dollars). While the rallying spirit and community culture of the people are strong, New Orleans and parts of surrounding Southern Louisiana have not yet fully recovered. Katrina remains the deadliest and most costly hurricane to make landfall in the United States in recorded history.
Here are just a few resources that tell the story. You are invited to review, learn, and remember.
Review - Learn - Remember - Prepare!
[ Back to Top ]

From NOAA News & Features
at https://www.noaa.gov/media-advisory/experts-to-preview-launch-of-historic-noaa-space-weather-satellite-observatory
August 14, 2025
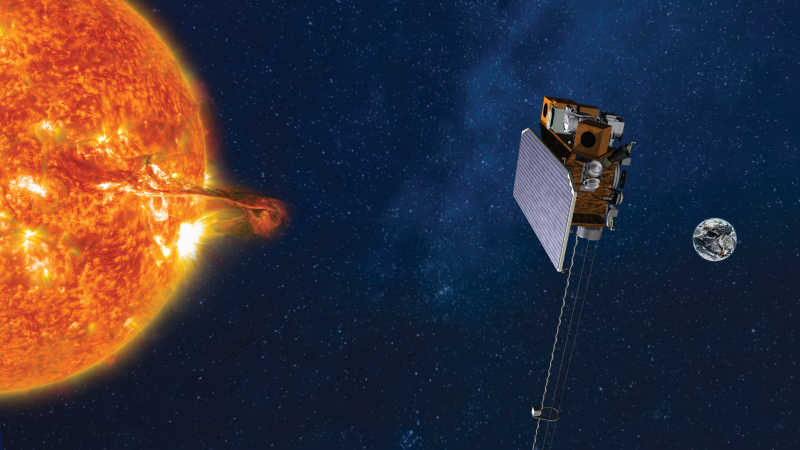
Experts from NOAA, NASA, BAE Systems, academia and industry will hold a virtual media briefing to preview the upcoming mission of NOAA's Space Weather Follow On - Lagrange 1 (SWFO-L1) observatory. SWFO-L1 will be NOAA's first satellite observatory designed specifically for – and fully dedicated to – continuous, operational space weather observations.
Space weather can severely affect our nation's power grid, communication systems, aviation industry and agricultural sector. SWFO-L1 will monitor solar eruptions and serve as an early warning beacon for hazardous space weather events that could profoundly impact our technology-dependent infrastructure and industries.
The satellite observatory is scheduled to lift off no earlier than September 2025 aboard a SpaceX Falcon Heavy rocket from NASA’s Kennedy Space Center in Florida. Once in orbit, SWFO-L1 will be positioned toward the sun at Lagrange point 1, which is approximately one million miles away from the Earth.
[ Back to Top ]
From NOAA's National Environmental Satellite, Data, and Information Service
at https://www.nesdis.noaa.gov/news/legacy-orbit-noaa-decommissions-the-poes-satellite-constellation
August 20, 2025
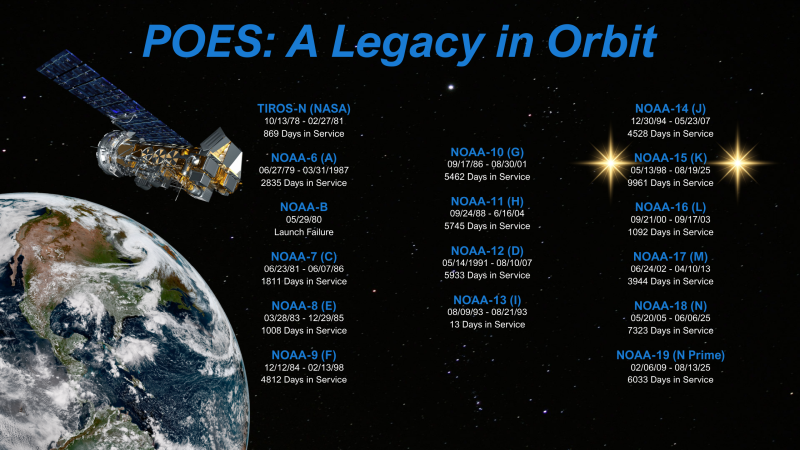
The Polar-orbiting Operational Environmental Satellites, also known as POES, have played an extremely important role in monitoring the planet’s weather and environment since the launch of the first satellite in the series in 1978. After more than four decades of continuous service, NOAA has retired the last two remaining satellites in its longest operating Earth-observing constellation.
Today, NOAA continues the critical mission of collecting weather observations from Low Earth Orbit (LEO) through its next-generation satellite system, the Joint Polar Satellite System (JPSS). Building on the legacy of POES and working in coordination with other NOAA and partner LEO satellites, JPSS features more advanced instruments, delivers data more quickly, and improves the accuracy of weather forecasts.
The long-running POES mission has concluded its final chapter. In August 2025, NOAA decommissioned the last two POES satellites: NOAA-15 on August 19, 2025, and NOAA-19 on August 13, 2025. This follows the recent emergency passivation of NOAA-18 on June 6, 2025, after the satellite lost functionality of its transmitter in late May. Passivation is the process of safely shutting down a satellite in a controlled manner by draining its batteries, turning off its transmitters, and deleting its onboard software so it can no longer operate or interfere with other spacecraft. This effectively ends an environmental satellite mission that spans 47 years.
[ Back to Top ]


From NOAA's National Environmental Satellite, Data, and Information Service
at https://www.nesdis.noaa.gov/news/category-5-erin-the-first-atlantic-hurricane-of-2025
August 22, 2025
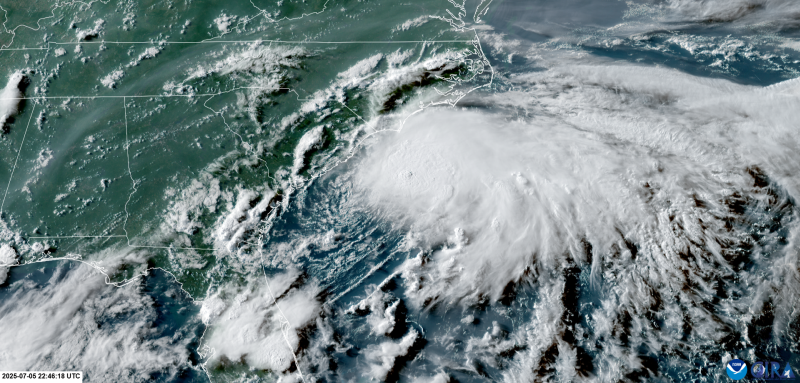
After a relatively quiet start to the Atlantic hurricane season, Erin became the first hurricane of the year in the Atlantic basin on Aug.15 and rapidly intensified into a major Category 5 storm the following day. This intensification is one of the fastest on record.
NOAA satellites have been closely tracking Erin since it started as a tropical wave off the coast of Africa on Aug. 9. The system strengthened into a tropical storm on Aug. 11, becoming the fifth named storm of the 2025 Atlantic season. The disturbance that became Erin passed near the Cape Verde island of São Vicente, triggering flooding that led to a disaster declaration and nine deaths according to media reports.
On Aug. 15, Erin strengthened into the first Atlantic hurricane of the season northeast of the Leeward Islands. By the morning of Aug. 16, Erin had rapidly intensified into a major Category 4 hurricane with maximum sustained winds of 145 mph, before strengthening further into a Category 5 storm with 160 mph winds northeast of Anguilla in the Caribbean. Since records began in 1851, there have only been 11 other Atlantic hurricanes that have had 145 mph winds or stronger by this point in the season - six of which date back to 1969, within the satellite era.
Check out aerial images of Hurricane Erin damage at https://oceanservice.noaa.gov/news/aug25/ngs-hurricane-erin.html.
[ Back to Top ]
From NOAA's National Environmental Satellite, Data, and Information Service
at https://www.nesdis.noaa.gov/news/wildfire-smoke-and-air-quality
July 28, 2025
Having accurate data to prepare for and respond to wildfires is essential to forecasters and communities, especially when smoke can impact air quality and visibility hundreds of miles from the fire source.
NOAA satellites provide valuable information about where fires are, their intensity and smoke emissions. This data then feeds into the operational air quality forecast models developed by the National Weather Service (NWS) and United States Environmental Protection Agency’s (EPA). Forecasters then combine this guidance with near real-time satellite aerosol imagery from the AerosolWatch website, a data distribution system maintained by NOAA’s Center for Satellite Applications and Research (STAR) as well as the EPA’s ground-based observations.
Together, these tools help forecasters provide more accurate advisories, warnings and alerts for hazardous air quality across the U.S., helping the public take steps to reduce exposure.
[ Back to Top ]
From NOAA National Environmental Satellite, Data, and Information Service
at https://www.nesdis.noaa.gov/news/how-noaa-preserves-and-maintains-long-term-hurricane-data-records
July 17, 2025
The Center for Satellite Applications and Research (STAR), a program office within NOAA’s National Satellite and Information Service (NESDIS), develops satellite-based products and tools to support weather forecasts with high quality, consistent data. These satellite products produce critical, timely information to forecasters at the NWS and the National Hurricane Center (NHC), having STAR play an essential role during hurricane season.
The National Centers for Environmental Information (NCEI), another office at NESDIS, supports STAR’s hurricane work by archiving and maintaining their long-term data records. These records include tropical cyclone precipitation, geostationary images, sea surface temperature, ocean heat and other environmental datasets.
[ Back to Top ]


From NOAA's National Environmental Satellite, Data, and Information Service
at https://www.nesdis.noaa.gov/news/noaa-satellites-help-certify-worlds-longest-lightning-flash
August 4, 2025
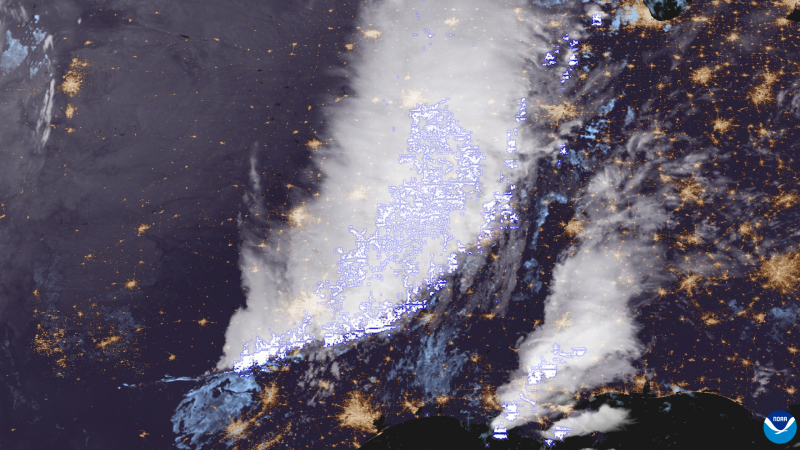
Sparked by a major thunderstorm complex rumbling over the Great Plains, a single megaflash lightning bolt captured by NOAA’s GOES-16 satellite was recently certified by the World Meteorological Organization (WMO) as the world’s longest flash on record. The horizontal distance of the bolt stretched 515 miles (829 km) from eastern Texas to near Kansas City, Mo., when it flashed across the sky on October 22, 2017.
This particular flash was not identified in the original 2017 analysis of the thunderstorm, but was discovered through a recent re-examination. It is nearly 38 miles (61 km) longer than the previous record-setting flash that lit up the southern U.S. on April 29, 2020, which was also verified through GOES-16 satellite imagery.
Learn more about the record lightning strike in the WMO press release.
See the original article at https://www.nesdis.noaa.gov/news/noaa-satellites-help-certify-worlds-longest-lightning-flash
[ Back to Top ]
By Madeleine Gregory, NASA's Goddard Space Flight Center
at https://science.nasa.gov/science-research/earth-science/harmonized-landsat-and-sentinel-2-collaboration-drives-innovation/
August 25, 2025
Landsat, a joint program of NASA and the U.S. Geological Survey (USGS), has been an invaluable tool for monitoring changes in Earth’s land surface for over 50 years. Researchers use instruments on Landsat satellites to monitor decades-long trends, including urbanization and agricultural expansion, as well as short-term dynamics, including water use and disaster recovery. However, scientists and land managers often encounter one critical limitation of this program: Landsat has a revisit time of eight days (with Landsat 8 and 9 operating), which is too long to capture events and disasters that occur on short timescales. Floods, for example, can quickly inundate a region, and cloud cover from storms can delay Landsat’s ability to get a clear observation on damage.
In 2015, the European Space Agency’s (ESA) Copernicus Sentinel-2A mission joined Landsat 7 and 8 in orbit. It was designed to collect comparable optical land data with the intention of leveraging Landsat's archive. Two years later, ESA launched Sentinel-2B, a satellite identical to Sentinel-2A.
Led by a science team at NASA’s Goddard Space Flight Center (GSFC), the USGS, NASA, and ESA began to work on combining the capabilities of Sentinel-2 and Landsat satellites. This idea was the impetus behind Harmonized Landsat and Sentinel-2 (HLS) project, a NASA initiative that created a seamless product from the Operational Land Imager (OLI) and Multi-Spectral Instrument (MSI) aboard Landsat and Sentinel-2 satellites, respectively.
[ Back to Top ]
By Jeanette Kazmierczak, NASA's Explore
at https://science.nasa.gov/missions/tess/astronomers-map-stellar-polka-dots-using-nasas-tess-kepler/
August 25, 2025
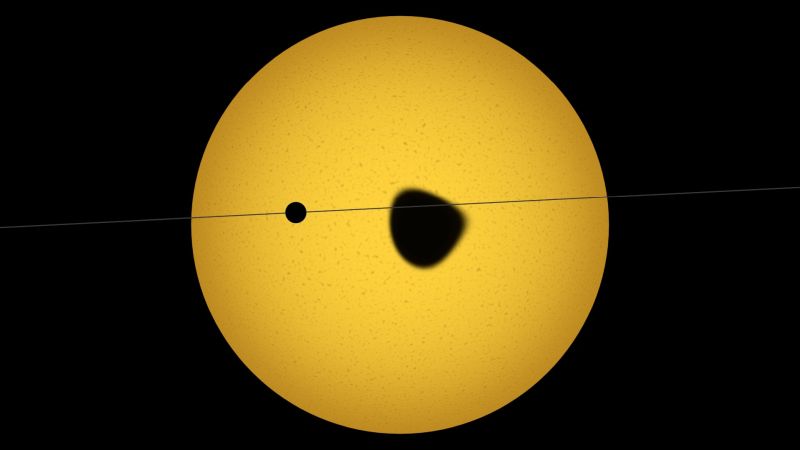
Scientists have devised a new method for mapping the spottiness of distant stars by using observations from NASA missions of orbiting planets crossing their stars' faces. The model builds on a technique researchers have used for decades to study star spots.
By improving astronomers' understanding of spotty stars, the new model — called StarryStarryProcess — can help discover more about planetary atmospheres and potential habitability using data from telescopes like NASA’s upcoming Pandora mission.
"Many of the models researchers use to analyze data from exoplanets, or worlds beyond our solar system, assume that stars are uniformly bright disks," said Sabina Sagynbayeva, a graduate student at Stony Brook University in New York. "But we know just by looking at our own Sun that stars are more complicated than that. Modeling complexity can be difficult, but our approach gives astronomers an idea of how many spots a star might have, where they are located, and how bright or dark they are."
A paper describing StarryStarryProcess, led by Sagynbayeva, published Monday, August 25, in The Astrophysical Journal.
[ Back to Top ]


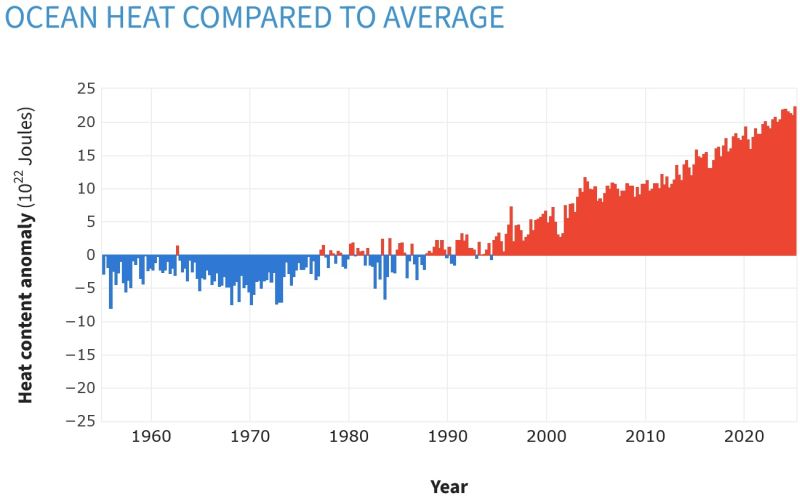
By Rebecca Lindsey and Luann Dahlman, NOAA Climate.gov
at https://www.climate.gov/news-features/understanding-climate/climate-change-ocean-heat-content
June 12, 2025
Rising amounts of greenhouse gases are preventing heat radiated from Earth’s surface from escaping into space as freely as it used to. Most of the excess atmospheric heat is passed back to the ocean. As a result, upper ocean heat content has increased significantly over the past few decades. Upper layers are accumulating heat faster than deeper layers, but averaged over the full depth of the global ocean, the 1993–2024 heat-gain rates are approximately 0.66 to 0.74 Watts per square meter averaged over the surface of the Earth.
[ Back to Top ]
From NOAA News & Features
at https://www.noaa.gov/news-release/noaa-unveils-powerful-convergence-of-ai-and-science-with-revolutionary-next-generation-fire-system
May 20, 2025
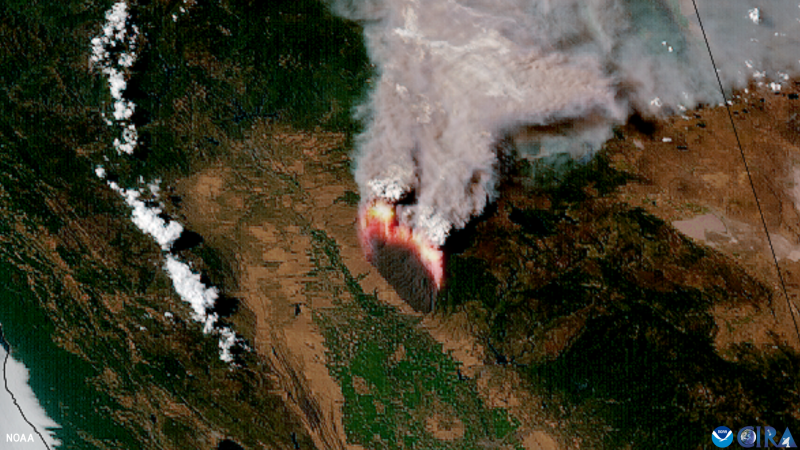
Less than a year after being evaluated in NOAA’s Fire Weather Testbed, the automated satellite fire detection capability of the experimental Next Generation Fire System (NGFS) has been embraced by the firefighting community and is being increasingly integrated into operations across the country.
The first of two key features of the revolutionary system are the Advanced Baseline Imager, the primary instrument on NOAA’s two GOES geostationary satellites orbiting 22,000 miles above the equator. The second is a set of NGFS algorithms that continuously comb through enormous volumes of data generated by the imager and automatically identifies heat anomalies or hot spots, even through clouds and smoke.
[ Back to Top ]
From NOAA National Environmental Satellite, Data, and Information Service
at https://www.nesdis.noaa.gov/news/space-sea-noaa-satellites-help-safeguard-alaskas-fisheries
July 31, 2025
Alaska’s waters are home to some of the world’s most productive commercial fisheries, harvesting species like pollock, cod, halibut, salmon and crab. These fisheries produce more than 60 percent of all seafood harvested in the United States, playing a critical role in both the local and national economies. The seafood industry is Alaska’s largest private employer, providing jobs for over 48,000 workers and contributing approximately $6 billion annually to the state’s economy. Nationally, it generates an estimated $15.8 billion in economic value and supports around 81,100 full-time-equivalent jobs across the country as seafood moves from ocean to table. Given the scale and importance of this industry, monitoring Alaska’s marine ecosystems is essential to ensuring long-term economic and environmental stability.
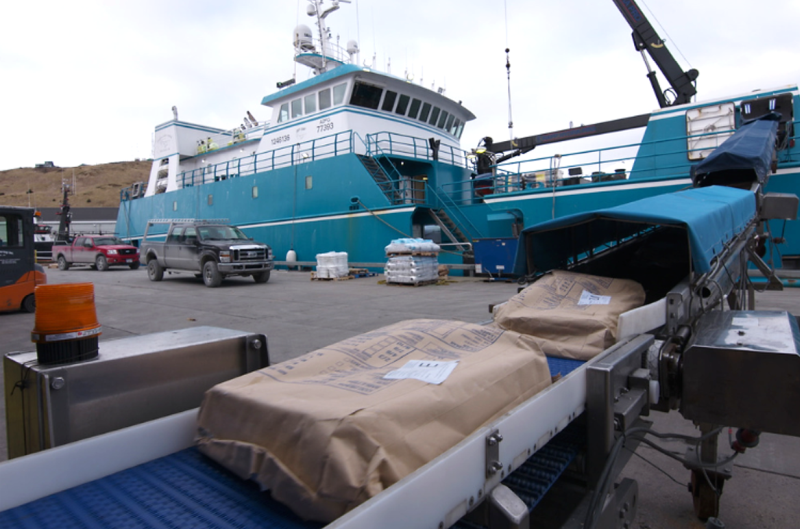
Low Earth orbit (LEO) satellites are vital for observing ocean conditions in high-latitude regions like Alaska. Orbiting the Earth from pole to pole, LEO satellites provide frequent and consistent coverage over Arctic regions, making them especially valuable for monitoring remote marine environments. Among these is NOAA’s Joint Polar Satellite System (JPSS), equipped with the Visible Infrared and Imaging Radiometer Suite (VIIRS).
[ Back to Top ]


By Monica Luabeya, NASA Explore
at https://www.nasa.gov/image-article/reaching-out/
August 26, 2025
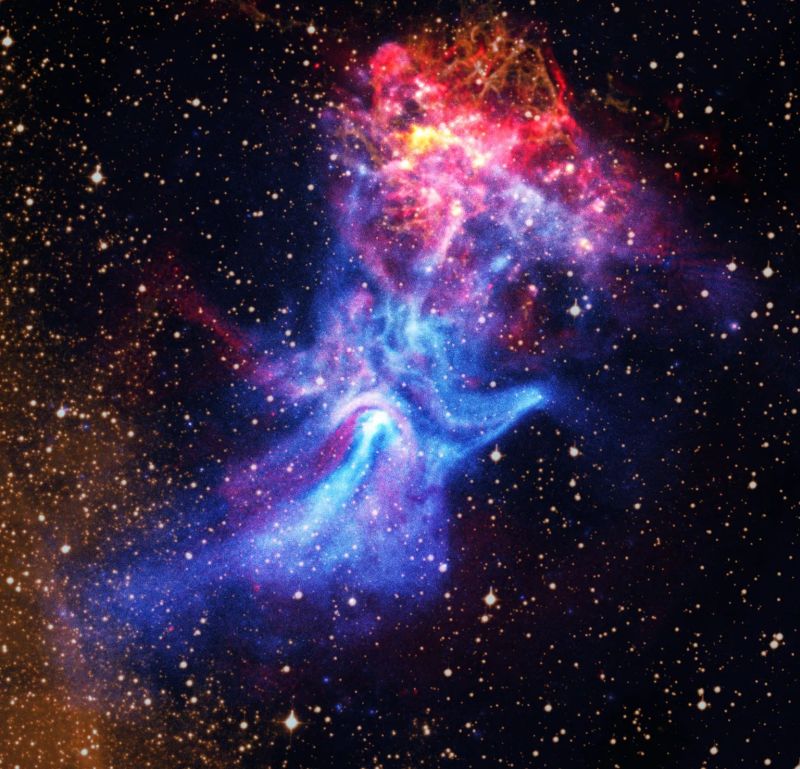
This image released on Aug. 20, 2025, combines new radio data from the Australia Telescope Compact Array with X-ray data from NASA’s Chandra X-ray Observatory. Chandra first released an image of this pulsar and its surrounding hand-shaped nebula in 2009. The new data provides a fresh view of this exploded star and its environment, which could help scientists understand its peculiar properties and shape.
Read the original article at https://www.nasa.gov/image-article/reaching-out/.
[ Back to Top ]
By Andrew Freedman, CNN weather
at https://www.cnn.com/2025/08/20/weather/noaa-satellites-climate-trump
August 20, 2025

The National Oceanic and Atmospheric Administration is narrowing the capabilities and reducing the number of next-generation weather and climate satellites it plans to build and launch in the coming decades, two people familiar with the plans told CNN.
This move — which comes as hurricane season ramps up with Erin lashing the East Coast — fits a pattern in which the Trump administration is seeking to not only slash climate pollution rules, but also reduce the information collected about the pollution in the first place. Critics of the plan also say it’s a short-sighted attempt to save money at the expense of understanding the oceans and atmosphere better.
[ Back to Top ]

By NASA Science Editorial Team
From NASA Explore at https://science.nasa.gov/science-research/astrophysics/from-nasa-citizen-scientist-to-astronaut-training-an-interview-with-benedetta-facini/
August 25, 2025
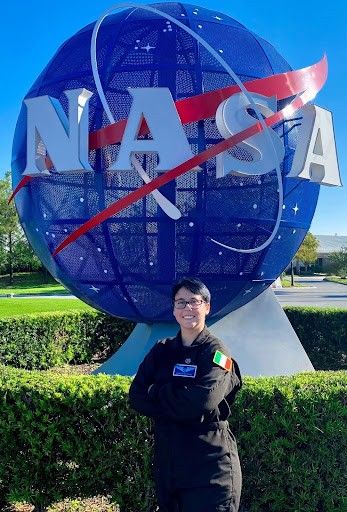
Titans Space Industries, a commercial space company, selected a new cohort of astronaut candidates this spring – and among them is NASA citizen scientist, Benedetta Facini. She has participated in not one, but many NASA citizen science projects: Cloudspotting on Mars, Active Asteroids, Daily Minor Planet, GLOBE, Exoasteroids and International Astronomical Collaboration (IASC). We asked her a few questions about her work with NASA and her path to becoming an astronaut candidate.
[ Back to Top ]


Interested in satellites and satellite data but not sure how to bring them into your classroom? We've got you covered!
Take advantage of these valuable opportunities and resources. They are just for you, and ready now.
[ Back to Top ]
By Beth Ridgeway, NASA Explore
at https://www.nasa.gov/centers-and-facilities/marshall/nasa-accepts-proposals-for-2026-student-launch-challenge/
August 25, 2025
NASA is kicking off the 2026 Student Launch challenge, looking for new student teams to design, build, and launch high-powered rockets with a scientific or engineering payload next April.
The agency is seeking proposals until Monday, Sept. 22. Details about this year’s challenge are in the 2026 handbook, which outlines the requirements for middle school, high school, and college students to participate. After a competitive proposal selection process, selected teams must meet documentation milestones and undergo detailed reviews throughout the activity year.
[ Back to Top ]
From NOAA Climate.gov
https://www.climate.gov/teaching
You are invited to explore Teaching Climate, an online guide to resources for teaching about climate and change, from NOAA's Climate.gov. Offerings include the following:
[ Back to Top ]
From NOAA Education
at https://www.noaa.gov/education/back-to-school
New and Updated for 2025
Are you a teacher or educator looking for science resources for the new school year ahead? Our educational resources from across NOAA cover topics from the bottom of the ocean to the surface of the sun. Consider the resources below must-haves for a successful year of teaching about the ocean and atmosphere!
Check out these new and updated for 2025...
[ Back to Top ]


On October 22, 2012, Tropical Depression Eighteen formed in the Caribbean Sea. Six hours later it became Tropical Storm Sandy. Over the next ten days, Sandy moved northward, crossed Jamaica and Cuba, ran along the Bahamas, then turned nortward to generally parallel the U.S. eastern seaboard while the storm center remained 200-400 miles offshore until October 29. On that date, Sandy made a left turn, increased its ground speed until in made landfall in New Jersey, then almost stalled about 100 miles inland. Sustained winds speeds at landfall were still at Category 1 hurricane level. Its cloud field covered all the northeast quadrant of the continental U.S. and much of eastern Canada. Called a superstorm by the news media, the extent of high winds, rainfall and snowfall for several days was unusually wide. Hurricane Sandy ranks second in destruction only to Hurricane Katrina. What did the meteorologists at the National Weather Service see that caused them to correctly forecast the storm's turn and destructive power? In this lesson learners investigate and compare characteristics of Hurricane Sandy with Hurricane Katrina using NOAA and NASA online access tools, ESRI's ArcGIS Online, and ImageJ software; then apply the same techniques to analysis of other storms.
| Grade Level: | 6-9 (adaptable to 4-5) |
| Time Requirement: | 1-3 class periods |
| Prerequisites: | None |
| Relevant Disciplines: | Life Science, Physical Science, Earth & Space Science, Geography |
[ Back to Top ]
Share your satellite-based lesson ideas with the teaching community.
Send us a complete lesson plan, or simply suggest a lesson idea. If you found the idea online, please share the source as well. The lesson can be about anything that helps connect learners with satellite-based technology - any grade level K-12 - any STEM subject area including geography.
Satellite-technology includes any part of the science, math, engineering, or technology of satellites, rockets, and remote sensing instruments as well as the use of any environmental satellite data to explore questions related to aspects of global change and local impacts in the long term, short term, and catastrophic time frames. Of special interest are lessons providing opportunities for learners to inquire, experiment, and apply mathematics.
Perhaps you designed a lesson yourself - we will happily prepare it for future publication in More Lessons from the Sky and inclusion in the SEA's online Lesson Plan Library with full credit to the originating author(s). Perhaps you found a worthy lesson plan published elsewhere - we will do the research for possible inclusion in a lesson plan spotlight. In either case, you will receive full credit for developing and/or bringing the lesson to the attention of the teaching community. Don't forget to share your insights if you tried the lesson with students.
Please share your ideas at SEA.Librarian@SatEd.org.
[ Back to Top ]

![]()
This edition of the SEA Newsletter was produced in HTML5.
It is best viewed with most recent updates of Firefox, Edge, Chrome, Opera, or Safari.
©Satellite Educators Association, Inc. (SEA) https://SatEd.org SEA.Newsletter@SatEd.org
Satellite Educators Association, Inc. is a 501(c)(3) non-profit educational organization to which donations are tax deductible.
The SEA Newsletter is published quarterly in March, June, September, and December.
The SEA Newsletter is published on-line and available at no cost.
SEA terms, conditions, policies, and contact information are detailed HERE.
Unless otherwise listed, all photo and image credits are the authors of the articles.
Any opinons expressed in this Newsletter are those of the authors
and not necessarily those of the Satellite Educators Association, Inc.
or any of its officers, members, or representatives.
Many SEA Newsletter items contain third-party links to sites not governed by Satellite
Educators Association, Inc. The viewer is cautioned to be aware of the terms of use and
privacy policies for those third-party sites.
![]()
