
OUR VISION
The world's finest educators supporting science, technology, engineering, and math (STEM) learning for pre-kindergarten to post-graduate students using real-world applications from satellites and satellite data.
OUR MISSION
To enhance the education environment to excite students about science, technology, engineering, and math through space-based technology -- satellites and satellite data.

Abraham Lincoln

What can schools do to defend democracy? Should they preach a specific political doctrine? I believe they should not. If they are able to teach young people to have a critical mind and a socially oriented attitude, they will have done all that is necessary.
Albert Einstein

TABLE OF CONTENTS
Click a RED link to view article
ASSOCIATION NEWS
PRESIDENT'S CORNER
EARTH SYSTEM SCIENCE
JOHN'S JOURNEY
STEVE'S SPACE
A LOOK BACK
ACCESS
ANALYZE
APPLY
IN THE NEWS
For Teachers
More Lessons
from the Sky

June 23, 2025
In this issue, the top story is the announcement of the annual meeting of members in the Satellite Educators Association, Inc.
The PRESIDENT'S CORNER Invites all Active SEA members to participate in SEA's Annual Meeting; Ron Gird's EARTH SYSTEM SCIENCE shares NOAA's predictions for an above-normal Atlantic hurricane season; JOHN'S JOURNEY explores techniques for engaging and preparing the next generation of scientific and technological leaders; STEVE MILLS offers his next chapter, "The Space Mission."
A LOOK BACK reviews the 1-1/4 ton mechanical computer used by the U.S. Coast & Geodetic Survey from 1910 to 1965 and highlights ten extraordinary women who broke barriers at NOAA from 1845 to 2018.
The SATELLITES section brings us the PACE satellite looking at harmful algal blooms in the ocean and NISAR, a joint NASA and India Space Research Organisation satellite imaging the Earth in two microwave bandwidths.
ACCESS includes a new ready-to-use dataset of land motion across North America; an update on atmospheric carbon dioxide; and how NOAA satellites are predicting tomorrow's floods today with new flood inundation mapping.
ANALYZE offers an update on global temperature change; how NASA sees forests from space using LIDAR; and the river waves seen from the NASA-French satellite SWOT.
APPLY highlights the unexpected results of coastal water quality from EMIT, an instrument on the space station; how AI is applied to MODIS image analysis; and GOES-19 tracking a significant Saharan dust storm blowing across the Atlantic.
IN THE NEWS reports the engineering of memory metal and NOAA decisions to defer upkeep on JPSS satellites in the face of a growing backlog of unsigned contracts.
FOR TEACHERS lists Teachers Institute on Wireless Technology offered by ARRL; how to "cook up a storm" in your kitchen; exploring our dynamic Sun; and designing drone-based solutions for climate education.
MORE LESSONS FROM THE SKY presents the latest update (June 2024) of the World Wide Weather lesson module for grades 3-5.
Enjoy!
--Editor

[ Back to Top ]

The annual meeting of Satellite Educators Association members is scheduled this summer. The Executive Committee is finalizing the date and setting the agenda. The online meeting will be offered via ZOOM. The exact date and time of the meeting and log in instructions will be emailed well before the meeting date.
The annual meeting agenda will include the standard reports on the state of the Association. Of special interest will be a vote on potential revisions to the Association's By-Laws. A volunteer committee approved by the SEA President tackled this job at the end of the 2024 meeting.
While lapsed and non-members are welcome to visit the annual meeting, only Active Members (those with dues paid) have voice and vote. To renew your membership, please visit Member Services at https://SatEd.org. To join as a new member, please visit Join Us at https://SatEd.org. In both cases, just follow the on-screen instructions to update or create your profile and pay $20 annual dues. More details about membership can be found in the Terms and Conditions page at https://SatEd.org/fineprint.html.
Membership in the Satellites Educators Association supports Association activities including this quarterly SEA Newsletter, the Web site SatEd.org with its curated Lesson Plan Library and Using Satellites In Education, and (for the last two years) the SmallSat Education Conference.
Don't miss this opportunity to let your voice be heard.
[ Back to Top ]


By Simon Cracknell, President, Satellite Educators Association
The annual meeting of the Satellites Educators Association, Inc. (SEA) is tentatively scheduled for the last week of July 2025. The exact date and time will be emailed soon. All active members of SEA (those with dues paid through July 31, 2025) have voice and vote at the meeting.
I have been working with the other members of the Executive Committee to establish the agenda for this meeting. Among other important topics will be discussions and votes on the future direction of SEA and the revised By-Laws of the corporation. I urge all interested persons to update their membership to Active status (if necessary) and join us for this important meeting.
Please see the Association News article above for more information.
[ Back to Top ]

By Ron Gird, Meteorologist and former Satellite/Spaceflight and Outreach Program Manager for the National Weather Service
From NOAA News & Features at https://www.noaa.gov/news-release/noaa-predicts-above-normal-2025-atlantic-hurricane-season
May 22, 2025
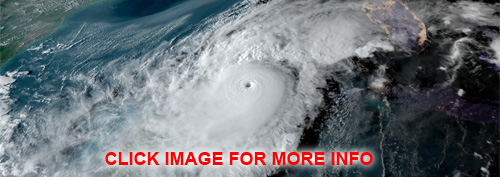
Forecasters within NOAA’s National Weather Service predict above-normal hurricane activity in the Atlantic basin this year.
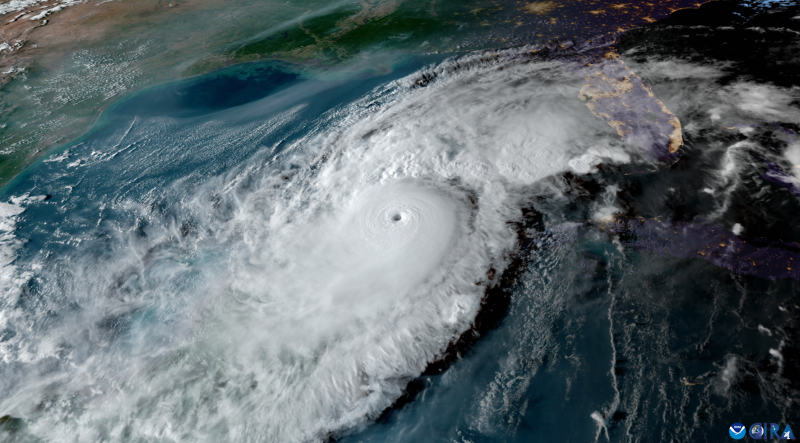
NOAA’s outlook for the 2025 Atlantic hurricane season, which goes from June 1 to November 30, predicts a 30% chance of a near-normal season, a 60% chance of an above-normal season, and a 10% chance of a below-normal season.
The agency is forecasting a range of 13 to 19 total named storms (winds of 39 mph or higher). Of those, 6-10 are forecast to become hurricanes (winds of 74 mph or higher), including 3-5 major hurricanes (category 3, 4 or 5; with winds of 111 mph or higher). NOAA has a 70% confidence in these ranges.
[ Back to Top ]


By John D. Moore, Executive Director, Institute for Earth Observations at Palmyra Cove, New Jersey
Perhaps not since the launch of Sputnik on October 4, 1957, have satellites played such a prominent role in both research and public awareness. Today, the demand for satellite applications in commercial and military sectors is growing rapidly. The Satellite Educators Association (SEA), with its long history of promoting satellite literacy and education since 1989, has consistently contributed to solutions in this evolving space. At a time when national security and economic competitiveness depend on technological leadership, SEA’s mission has never been more critical. Our guiding question remains: How do we engage and prepare the next generation?
As satellite missions and orbital instrumentation continue to rapidly evolve, so too do the opportunities for learners of all ages to engage in Earth system science from two complementary perspectives: from the ground-up and from space-down. This dual approach is embodied in what is called the SEES Model — Space to Earth: Earth and Space — which merges satellite imagery and data with local, ground-based observations to enhance scientific understanding through verification and application.
This model empowers students, teachers, and citizen scientists to take an active role in Earth observations, not only interpreting satellite data but also contributing to its validation. In the process, participants acquire real-world skills in data collection, scientific analysis, and spatial reasoning-critical elements of geoscience and aerospace education.
One notable SEES-aligned initiative underway at the Institute for Earth Observations (IEO) is our participation in the National Ozone Garden Network, led by the University Corporation for Atmospheric Research (UCAR). This hands-on experience follows the Acquire–Analyze–Apply or the A3 Model of learning — data is acquired through direct observation, analyzed using satellite data tools, and applied to real-world questions about air quality and environmental health.
Through this project, we are cultivating an Ozone Bioindicator Garden that uses living plants to detect and document ground-level ozone damage. Certain plant species, such as milkweed and snap beans, act as sensitive bioindicators. When exposed to elevated ozone levels, these species develop characteristic foliar injuries that can be observed, recorded, and compared over time. Our ground-based observations are compared and analyzed with sensitive air quality instrumentation and are then matched with atmospheric ozone measurements from NASA’s TEMPO mission.
TEMPO (Tropospheric Emissions: Monitoring of Pollution) is a geostationary ultraviolet and visible spectrometer designed to monitor air pollution across North America. Scanning hourly, TEMPO provides unprecedented temporal and spatial resolution of ozone and related pollutants in the troposphere. It is a collaborative mission led by the Smithsonian Astrophysical Observatory, with key partners including NASA Langley Research Center and Ball Aerospace.

By combining ground-based ozone observations with satellite data from TEMPO, students and teachers participate in an authentic Earth science investigation. It’s inspiring to see that national air quality can be monitored daily — from space.
The SEES Model is reflected in a growing number of educational citizen science efforts, including several projects hosted on NASA’s GLOBE Observer app. These efforts support space-ground collaborations across multiple environmental systems:
These initiatives represent scalable, curriculum-connected activities that integrate classroom learning with satellite data platforms, making them ideal for formal and informal education settings alike.
In 1981, I was hired to develop and teach a new course called Environmental Technologies at a vocational-technical school. At the time, "technology" in the classroom looked very different - no internet, no classroom computers, and very limited access to real-time data.
Over time, the course evolved into Geoscience and Remote Sensing, and eventually into Geospatial Technologies through a partnership with a local community college. By 1985, my students were applying real-world skills to investigate the Earth from space. A Perkins Grant helped us purchase a GOES satellite receiver, allowing students to access and analyze satellite data — cutting-edge work for its time.
Around that same period, the first Satellites & Education Conference took place at West Chester University, marking the beginning of a wider movement to integrate satellite science into K–12 education.
Today, the possibilities are far greater. Students in Career Technical Education (CTE) programs now build and fly their own SmallSats - some even reaching near - space via high-altitude balloons. What was once futuristic is now hands-on and accessible in many schools across the country.
As CTE reclaims its place in the national education conversation, it’s essential to support programs that blend career skills with scientific discovery. Satellite and space-based education offers students direct engagement with the tools and technologies shaping our future.
To prepare tomorrow’s workforce, we must continue investing in CTE programs that empower students to explore, build, and launch - not only their own spacecraft, but their own futures.
The SEES Model is more than a teaching tool. It is a pathway to Career and Technical Education, preparing students with skills that are in high demand across geospatial technology, aerospace, and environmental science sectors. By engaging with real-time data from platforms like TEMPO, ICESat-2, and LANDSAT, students gain experience in:
The A3 Educational Model emphasizes three key stages in CTE-STEM education:
These are not abstract skills — they are directly aligned with career paths in atmospheric science, remote sensing, computer science and use of artificial intelligence (AI), data analytics, environmental technology, and Earth system research. Through the SEES Model, students experience what it means to be part of the scientific process, while also building a foundation for post secondary pathways in STEM, CTE, and beyond. The A3 Model provides hands-on activity that develops proficiencies for the future. It is all about Workforce Readiness.
In this way, the combined A3 and SEES Model not only enriches Earth System education, but also fulfills a critical need: to inspire, prepare, and equip the next generation of satellite scientists, data analysts, and geosciences scientists.
Just in the past few months, the Institute for Earth Observations has introduced more than 1,000 middle school students to satellite science through immersive experiences in our Outdoor Laboratory - 250 acres of conservation land serving as a real-world Earth Observatory. Students explore environmental systems, analyze data, and discover the possibilities of careers in geoscience and technology.
Let’s be clear. This kind of science is not routinely taught in most U.S. public schools. That’s why this work is not just exciting, it’s essential.
My journey continues in the coming months. SEA members are invited to join me at these events:
...and remember..."you can teach anything with satellites."
Stay safe - stay well
For now, I'm John ... and this is my journey.
[ Back to Top ]


By Steve Mills, Retired Systems Engineering Scientist; owner and Chief Engineer of Polymath Geo
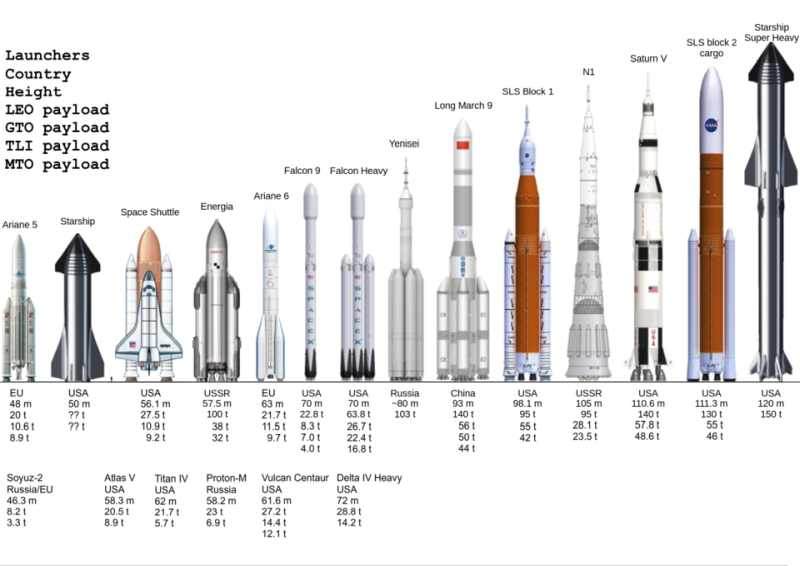
The original meaning of the word "mission" was religious, meaning the sending out of Catholic priests and brothers to a specified foreign land for the purpose of spreading the religion. By the twentieth century the word was generalized to mean sending out people to a place for a specific purpose. In the 1930’s the United States military began using "mission" to mean the "dispatch of an aircraft on a military operation," and when the space age began in the 1950’s this meaning was extended to spacecraft. A space mission is defined very generally as a journey by a vehicle in space to accomplish specific objectives.
The first real space mission was Sputnik I, launched by the USSR in 1957. Its primary mission was very simple -- to be Earth’s first artificial satellite. Its only device onboard was a radio that transmitted a repeating "beep beep" signal. The signal could be picked up by amateur radio operators throughout most of the world and was intended to prove to the world that the mission was a success. This radio signal also gave Sputnik I a secondary scientific mission. It was broadcast simultaneously at two different frequencies, 20 and 40 MHz, and this could be used to estimate electron density of the ionosphere.
The Mission objectives should be specific. For example, "This satellite will measure the weather," is not specific enough to be a mission objective because it does not say where, when, how often or what specific aspects of the weather are to be measured. Here is an example of the more specific mission of the GOES-18 weather satellite operated by NOAA:
GOES-18 provides continuous weather imagery and data from a geostationary orbit centered at 136.9° west latitude. Its planned operation is for 15 years starting 3 January 2023. It includes two meteorological instruments: the Advanced Baseline Imager (ABI) with 16 channels from visible light to longwave infrared that is updated every 15 minutes; and the Geostationary Lightning Mapper (GLM), that maps the location and time of lightning flashes. It also contains several smaller instruments to collect solar radiation and space weather data.
A full description of the GOES-18 mission would be much longer than this, giving more details on the purposes of ABI and GLM.
A space mission requires a great amount of planning. For comparison, consider how your family would plan a trip to attend a wedding celebration 500 miles away. First you would need to decide what vehicle to use to get there. Do you take a train, a plane or do you drive a car? If you decide to drive, you may have to decide which car to use or whether to rent a car. You may want to have an auto mechanic check the car for any problems. You would also need to choose what things to bring and the luggage to keep it in. You would need to plan a route and understand how long it will take. This is all mission planning. Now you could decide to change the route or use a different vehicle, then the mission plan will change, but the actual mission, that is, to attend the wedding, does not change.
At this point it would be useful to define several terms used to discuss a space mission.
For more on the Kessler Syndrome, please consult the following:
Kessler, David; Anz-Meador, Phillip (March 2001). "Critical Number of Spacecraft in Low Earth Orbit: Using Fragmentation Data to Evaluate the Stability of the Orbital Debris Environment." Proceedings of the Third European Conference on Space Debris. Darmstadt, Germany.
There is no standard way to group and organize space missions. In the aerospace business missions tend to be distinguished by the customer or government agency that is paying for the mission. So, they may classify contracts as commercial, US Space Force, NSA, NASA, NOAA, ESA or some other government agency. This list is not exhaustive, since other nations such as Japan and South Korea have their own space agencies.
Another way to define type of mission is to consider its objectives, regardless of who is paying for it. Here is one possible classification scheme:
Uncrewed Missions:
Crewed Missions:
A Crewed (or Manned) Mission is any that includes a crew of one or more persons. In 2023 only 3% of space launches had a crew. Space is a very hostile environment for the human body, so crewed missions are dangerous, expensive, and therefore, rare. However, because these missions stimulate the human imagination, crewed missions received much more than 3% of the public’s attention and funding. Approximately half of NASA's annual budget is allocated to crewed missions.
A space mission requires years of preparation before it is launched and involves hundreds or even thousands of individuals. For planning purposes NASA defines the phases of a mission as follows:
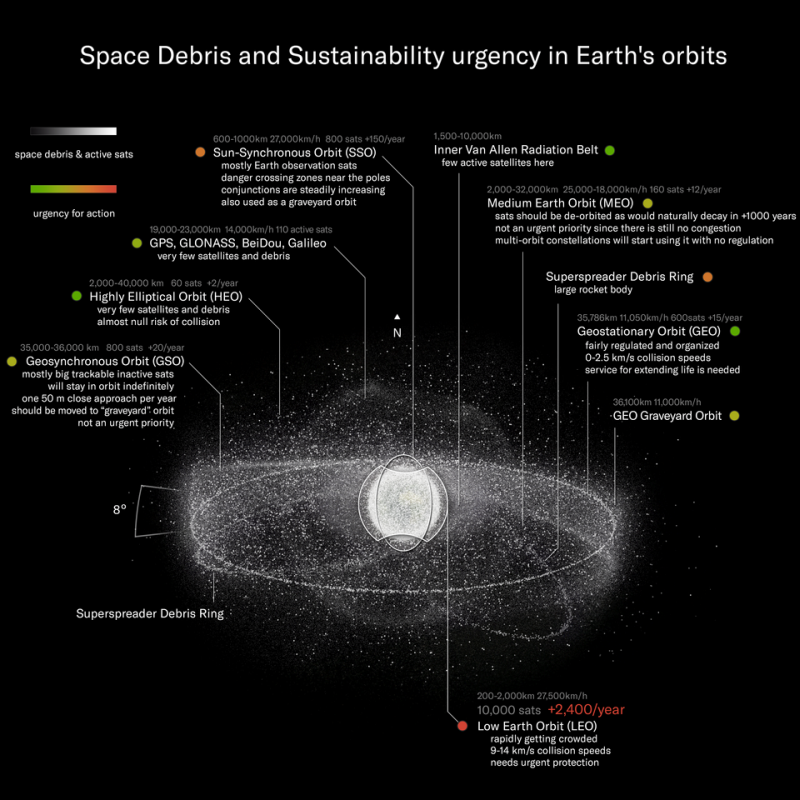
Note that one of the last items is deorbiting or disposal. As noted earlier, space junk and space debris are becoming a major problem. One solution is to establish graveyard orbits where decommissioned satellites can be moved to orbits where they cannot do much harm (see Figure 2).
For a more detailed look at space mission planning and implementation, please consult Dave Doody's online Basics of Space Flight at https://science.nasa.gov/learn/basics-of-space-flight/, especially Chapter 7: Mission Inception.
In my next column, I will describe how communications, data and data processing are used in space programs. See you then!
[ Back to Top ]


From NOAA News & Features
at https://www.noaa.gov/heritage/multimedia/video/noaa-rewind-brass-brains
June 5, 2023
The "NOAA Rewind" series highlights artifacts and stories from NOAA’s history in approximately one minute. Learn more about NOAA’s history at noaa.gov/heritage.
This is Brass Brains, the U.S. government's first computer design.
It's essentially a 2,500 pound mechanical computer made of pulleys, gears, and chains.
The U.S. Coast & Geodetic Survey used it from 1910 to 1965 to predict tides.
Brass Brains uses 37 factors related to the motions and positions of the Earth, moon, and sun.
Brass Brains did in one day what would take 125 mathematicians the same length of time.
After its invention, the number of shipwrecks was cut in half in two years’ time.
During WWI, WWII, and the Korean War, it was used to plan amphibious invasions and kept under lock and key to prevent sabotage.
Believe it or not, NOAA still has Brass Brains and it still works today!
[ Back to Top ]
From NOAA News & Features
at https://www.noaa.gov/heritage/multimedia/video/gamechangers
March 3, 2025
Learn more about NOAA’s history at noaa.gov/heritage.
10... 9... 8... 7... 6... 5... 4... 3... 2... 1
Gamechangers:
10 women who broke barriers at NOAA
Maria Mitchell
The first woman hired by the federal government in a professional capacity as an astronomer for the U.S. Coast Survey.
1845
Rachel Carson
The first woman to go out on a Bureau of Fisheries research vessel.
1949
Hazel Tatro
The U.S. Weather Bureau’s first female meteorologist-in-charge. She ran the Winston-Salem, North Carolina station.
1964
Sylvia Earle
Led the first all-female aquanaut research team.
1970
Pamela Chelgren
The first female officer in the NOAA Corps.
1972
Hilda Gohrband
The first female computer scientist at NOAA.
1973
Evelyn Fields
The first African American woman to join the NOAA Corps.
1973
Dr. Patricia M. Clay
The first female anthropologist at NOAA.
1992
Rebecca Waddington & Kristie Twining
The first all-female team to pilot a NOAA aircraft during a hurricane mission.
2018
[ Back to Top ]


A film by Emma Watkins for NASA Explore
at https://plus.nasa.gov/video/an-ocean-in-bloom/
August 14, 2024
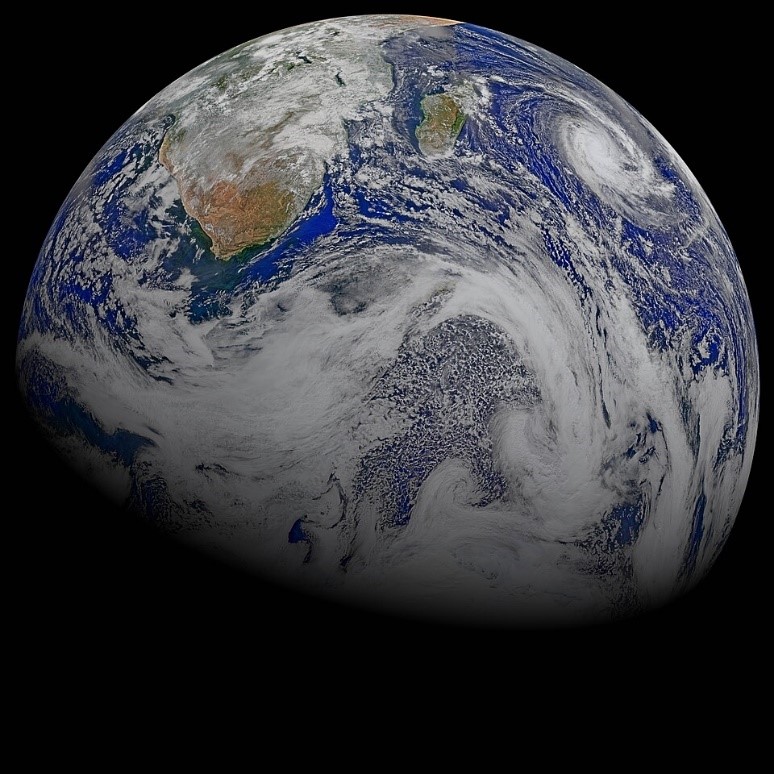
From the far reaches of space, NASA scientists aim to expand their knowledge of how our ocean, atmosphere, and ecosystems interact with one another through the launch of the PACE satellite. By identifying and examining harmful algal blooms around the world, PACE will inform communities ranging from local fishermen to large corporations on what is occurring in their backyard and beyond. From sea to space, the PACE satellite will take Earth’s pulse in astounding ways for decades to come.
The original post in 4K video can be seen HERE.
[ Back to Top ]
From NASA Jet Propulsion Laboratory
at https://nisar.jpl.nasa.gov/
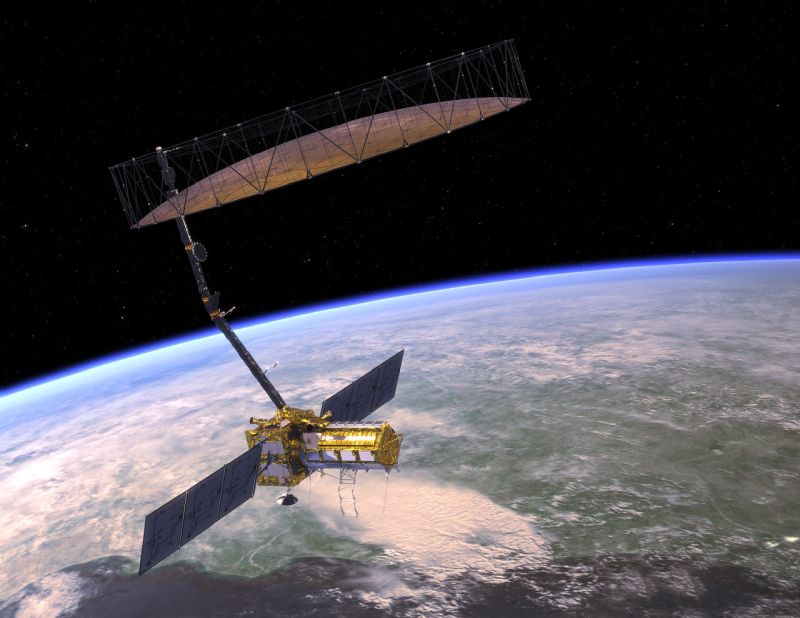
NISAR is the first satellite mission to collect radar data in two microwave bandwidth regions, called the L-band and the S-band, to measure changes of our planet’s surface, including movements as small as centimeter. This allows the mission to observe a wide range of Earth processes, from the flow rates of glaciers and ice sheets to the dynamics of earthquakes and volcanoes.
Find out everything you want to know about NISAR, its long list of data applications, and how you can be involved by visiting https://nisar.jpl.nasa.gov/ today.
[ Back to Top ]


From NASA Jet Propulsion Laboratory
at https://www.jpl.nasa.gov/news/nasas-ready-to-use-dataset-details-land-motion-across-north-america/
June 6, 2025
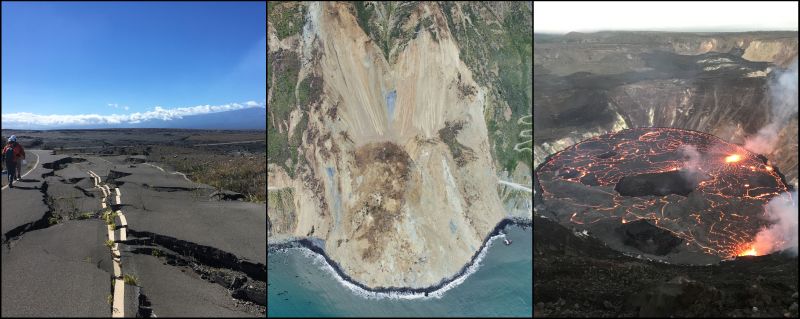
NASA is collaborating with the Alaska Satellite Facility in Fairbanks to create a powerful web-based tool that will show the movement of land across North America down to less than an inch. The online portal and its underlying dataset unlock a trove of satellite radar measurements that can help anyone identify where and by how much the land beneath their feet may be moving — whether from earthquakes, volcanoes, landslides, or the extraction of underground natural resources such as groundwater.
Spearheaded by NASA’s Observational Products for End-Users from Remote Sensing Analysis (OPERA) project at the agency’s Jet Propulsion Laboratory in Southern California, the effort equips users with information that would otherwise take years of training to produce. The project builds on measurements from spaceborne synthetic aperture radars, or SARs, to generate high-resolution data on how Earth’s surface is moving.
[ Back to Top ]
By Rebecca Lindsey & John Miller from Climate.gov
at https://www.climate.gov/news-features/understanding-climate/climate-change-atmospheric-carbon-dioxide
May 21, 2025
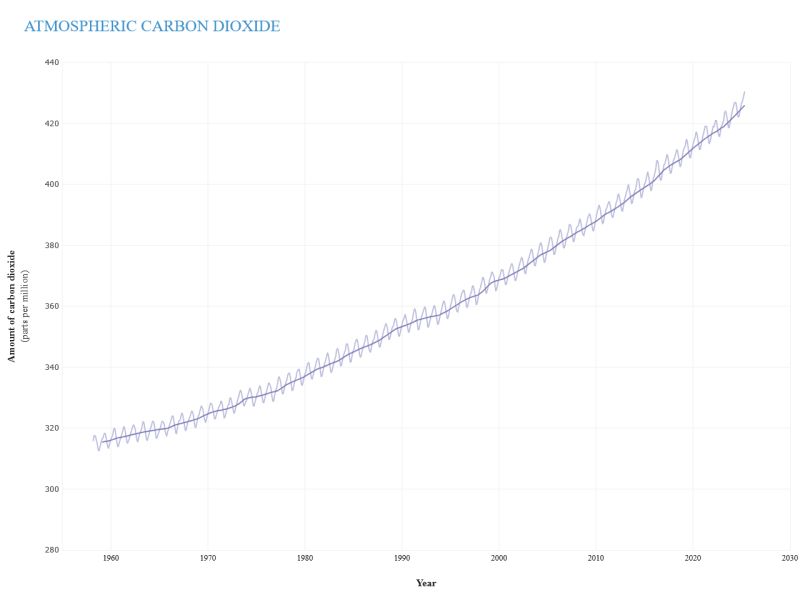
Based on the annual analysis from NOAA’s Global Monitoring Lab, global average atmospheric carbon dioxide was 422.8 parts per million ("ppm," for short) in 2024, a new record high. The increase during 2024 was 3.75 ppm — the largest one-year increase on record. At Mauna Loa Observatory in Hawaii (graph above), where the modern carbon dioxide record began in 1958, the annual average carbon dioxide in 2024 was 424.61 ppm, also a new record.
The years with the largest annual carbon dioxide growth tend to be associated with the strongest El Niños — the warm phase of a natural climate pattern in the tropical Pacific — which lead to high temperatures over land and sea and an expansion of global drought area. In turn, these weather conditions typically lead to less plant growth, which reduces carbon dioxide uptake, as well as increased decomposition of carbon in soil and increased carbon dioxide emissions from forest fires. Together, these impacts cause atmospheric carbon dioxide levels to rise faster than normal.
[ Back to Top ]
From NOAA National Environmental Satellite, Data, and Information Service
at https://www.nesdis.noaa.gov/news/seeing-tomorrows-floods-today-the-role-of-noaa-satellites-inundation-mapping
June 2, 2025
River flooding poses a serious threat to communities across the United States, endangering roughly 41 million Americans and putting an estimated $5.5 trillion in assets at risk. It occurs when heavy rainfall causes rivers, creeks or streams to overflow their banks, often affecting areas far beyond where the rain fell. Peak flooding can sometimes arrive days after a storm, making it difficult to anticipate the full impact. River floods can severely damage infrastructure, destroy crops, disrupt ecosystems, contaminate water supplies and displace entire neighborhoods. These widespread impacts highlight the critical need for accessible tools that can accurately predict where flooding is anticipated to occur, so communities can prepare and respond effectively.
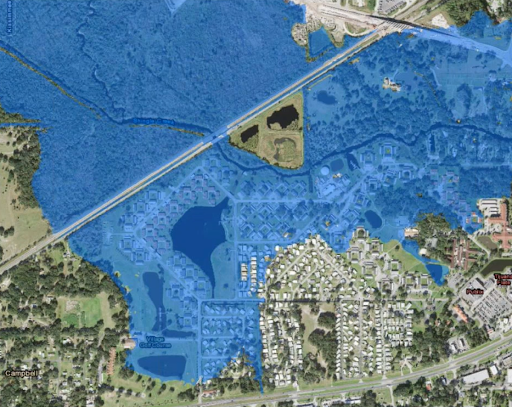
To meet this need, NOAA’s National Water Center has developed experimental Flood Inundation Mapping (FIM) Services to better depict where river flooding is happening and where it could spread. These interactive online maps display flood extent down to the street level, creating "flood footprints" of areas already underwater or at risk over the next five days. FIM maps are a vital support tool for emergency managers who require precise information to make time-sensitive decisions, such as issuing evacuation orders. Once fully rolled out in 2026, FIM maps will cover about 3.4 million river miles, greatly enhancing emergency preparedness and response efforts for floods nationwide.
[ Back to Top ]


By Rebecca Lindsey, Luann Dahlman, Jessica Blunden, NOAA Cimate.gov
at https://www.climate.gov/news-features/understanding-climate/climate-change-global-temperature
April 10, 2025
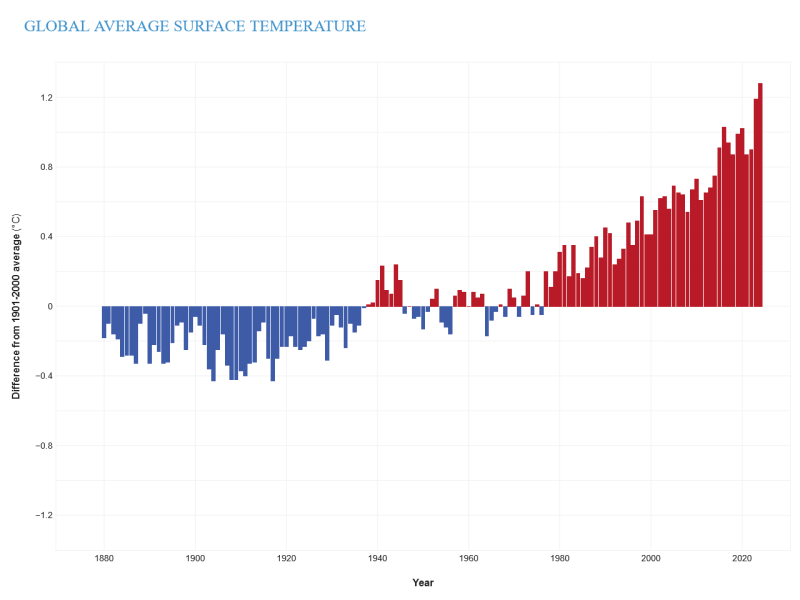
According to the annual report from NOAA National Centers for Environmental Information, 2024 was the warmest year since global records began in 1850. The global average surface temperature was 2.32 Fahrenheit (1.29 degrees Celsius) above the 20th-century average (57.0 degrees Fahrenheit, or 13.9 degrees Celsius) and 2.63 degrees Fahrenheit (1.46 degrees Celsius) above the pre-industrial average (56.7 degrees Fahrenheit, or 13.7 degrees Celsius), which NOAA defines as the period from 1850-1900.
[ Back to Top ]
From NASA's Earth Science Division Editorial Team
at https://science.nasa.gov/earth/from-space-to-soil-how-nasa-sees-forests/
June 17, 2025
NASA uses satellite lidar technology to study Earth’s forests, key carbon sinks.
NASA uses satellite lidar technology to study Earth’s forests, key carbon sinks. The GEDI mission maps forest height and biomass from the International Space Station, while ICESat-2 fills polar data gaps. Together, they enable a first-of-its-kind global biomass map, guiding smarter forest conservation and carbon tracking.
See the original post and explore more at https://science.nasa.gov/earth/from-space-to-soil-how-nasa-sees-forests/.
[ Back to Top ]
By Sally Younger, NASA's Earth Science News Team, NASA Jet Propulsion Laboratory
at https://www.jpl.nasa.gov/news/nasa-french-satellite-spots-large-scale-river-waves-for-first-time/
May 21, 2025
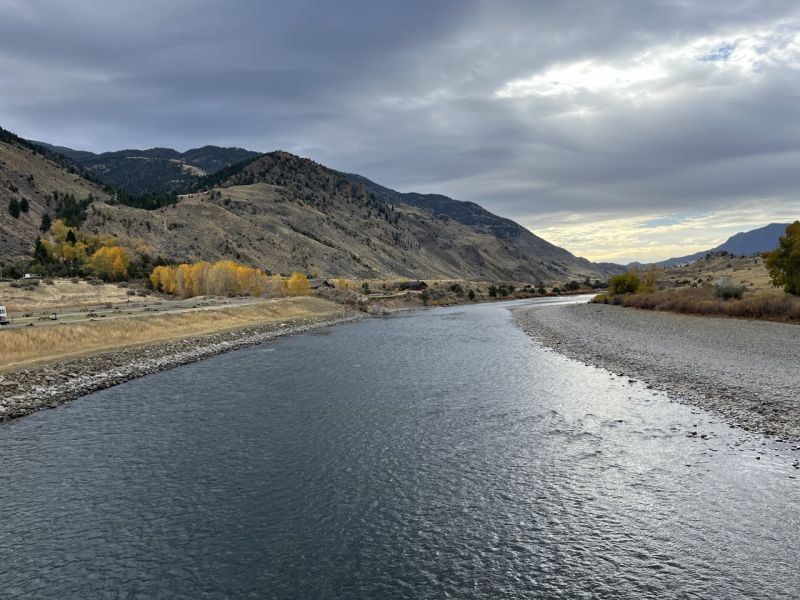
In a first, researchers from NASA and Virginia Tech used satellite data to measure the height and speed of potentially hazardous flood waves traveling down U.S. rivers. The three waves they tracked were likely caused by extreme rainfall and by a loosened ice jam. While there is currently no database that compiles satellite data on river flood waves, the new study highlights the potential of space-based observations to aid hydrologists and engineers, especially those working in communities along river networks with limited flood control structures such as levees and flood gates.
Unlike ocean waves, which are ordinarily driven by wind and tides, and roll to shore at a steady clip, river waves (also called flood or flow waves) are temporary surges stretching tens to hundreds of miles. Typically caused by rainfall or seasonal snowmelt, they are essential to shuttling nutrients and organisms down a river. But they can also pose hazards: Extreme river waves triggered by a prolonged downpour or dam break can produce floods.
"Ocean waves are well known from surfing and sailing, but rivers are the arteries of the planet. We want to understand their dynamics," said Cedric David, a hydrologist at NASA’s Jet Propulsion Laboratory in Southern California and a coauthor of a new study published May 14 in Geophysical Research Letters.
[ Back to Top ]


By Sally Younger, NASA Jet Propulsion Laboratory
at https://www.jpl.nasa.gov/news/nasa-sensor-on-space-station-eyes-contamination-off-california-coast/
June 12, 2025
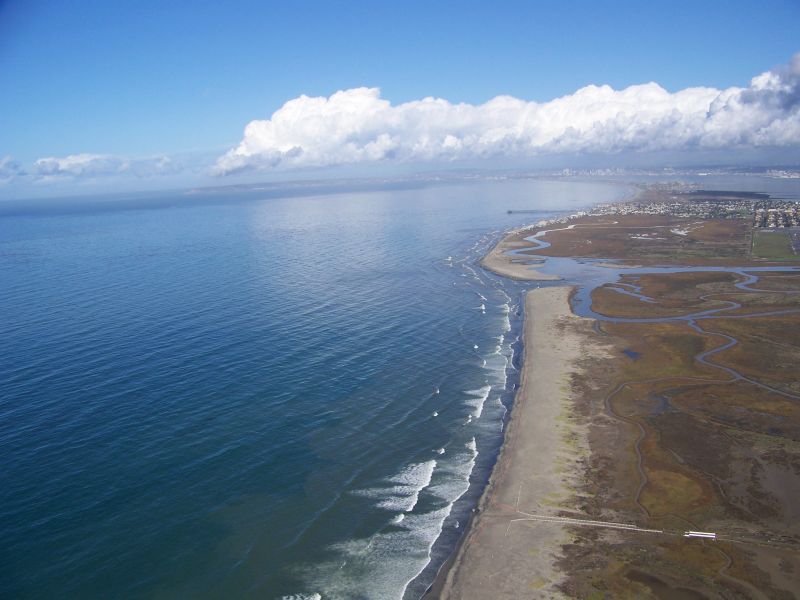
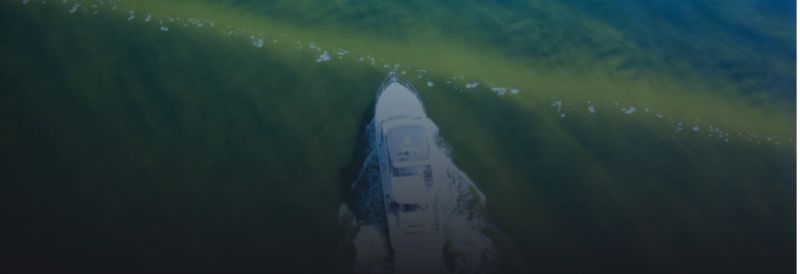
An instrument built at NASA’s Jet Propulsion Laboratory to map minerals on Earth is now revealing clues about water quality. A recent study found that EMIT (Earth Surface Mineral Dust Source Investigation) was able to identify signs of sewage in the water at a Southern California beach.
The authors of the study examined a large wastewater plume at the mouth of the Tijuana River, south of Imperial Beach near San Diego. Every year, millions of gallons of treated and untreated sewage enter the river, which carries pollutants through communities and a national reserve on the U.S.-Mexico border before emptying into the Pacific Ocean. Contaminated coastal waters have been known to impact human health — from beachgoers to U.S. Navy trainees — and harm marine ecosystems, fisheries, and wildlife.
[ Back to Top ]
By Charlie Plain, NASA EarthData
at https://www.earthdata.nasa.gov/news/feature-articles/applying-ai-modis-data-analysis?utm_source=newsletter&utm_medium=email&utm_campaign=earthdata-discovery-052025
May 9, 2025
Artificial intelligence systems can rapidly analyze massive amounts of NASA’s Earth data, discover embedded information, and make the valuable measurements even more useful. To make the most of this technology, researchers with Goddard Space Flight Center in Greenbelt, Maryland, recently trained supercomputers to learn information from one of NASA’s marquee datasets, Moderate Resolution Imaging Spectroradiometer (MODIS) imagery. The center’s Data Science Group used machine-learning techniques to train a model to learn visual patterns and discern atmospheric features such as clouds or dust from land, water, and other features in millions of MODIS images.
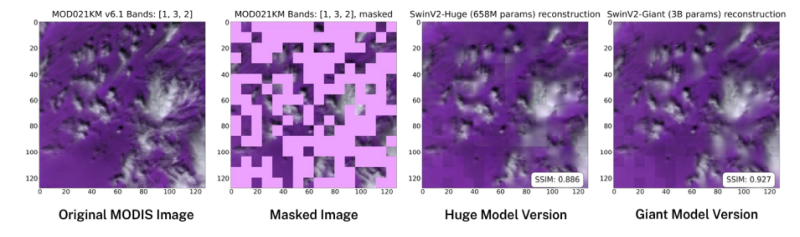
This powerful generative artificial intelligence (AI) model, called SatVision-TOA (Top-of-Atmosphere), can make very accurate predictions to complete the shape of objects in obscured images and quickly identify features for analysis. SatVision-TOA has broad applications including cloud property retrieval, land cover mapping, flood and disaster monitoring, urban planning, and environmental analysis. What’s more, the model can potentially be applied to imagery from other instruments with technology similar to MODIS.
[ Back to Top ]
From NOAA National Environmental Satellite, Data, and Information Service
at https://www.nesdis.noaa.gov/news/noaas-satellites-track-saharan-dust-blowing-across-the-atlantic
June 4, 2025
A giant plume of dust from the Sahara Desert made its way from Africa to the United States to kick off the start of meteorological summer in the Northern Hemisphere.
NOAA’s GOES-19 satellite captured this multi-day time lapse imagery of the dust blowing thousands of miles across the Atlantic from May 28th to June 2nd.
The dust is due to a two to 2.5-mile-thick layer of the atmosphere, called the Saharan Air Layer, crossing over the Atlantic Ocean. The warmth, dryness and strong winds associated with this layer have been shown to suppress tropical cyclone formation and intensification.
When it reaches the U.S., it can cause hazy skies as well as vivid sunrises and sunsets as the sun’s rays scatter the dust in the atmosphere. It can even suppress thunderstorm development over locations where the dust is especially thick.
[ Back to Top ]


By NASA STEM Team
at https://www.nasa.gov/learning-resources/career-exploration-using-ingenuity-and-innovation-to-create-memory-metals/
June 17, 2025
Othmane Benafan is a NASA engineer whose work is literally reshaping how we use aerospace materials — he creates metals that can shape shift. Benafan, a materials research engineer at NASA’s Glenn Research Center in Cleveland, creates metals called shape memory alloys that are custom-made to solve some of the most pressing challenges of space exploration and aviation.
"A shape memory alloy starts off just like any other metal, except it has this wonderful property: it can remember shapes," Benafan says. "You can bend it, you can deform it out of shape, and once you heat it, it returns to its shape."
An alloy is a metal that’s created by combining two or more metallic elements. Shape memory alloys are functional metals. Unlike structural metals, which are fixed metal shapes used for construction or holding heavy objects, functional metals are valued for unique properties that enable them to carry out specific actions.
[ Back to Top ]
By Scott Waldman, E&E News by Politico
at https://www.eenews.net/articles/noaa-abandons-plan-to-defer-upkeep-of-key-weather-satellites/
April 6, 2025
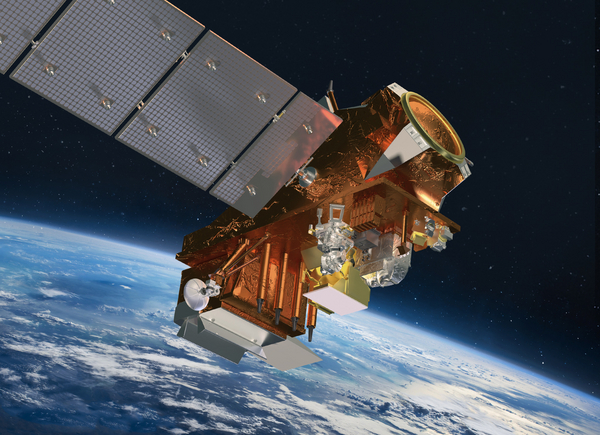
NOAA has backed off a plan that would have deferred the maintenance of satellites critical to weather forecasts and storm predictions.
A March 28 memo obtained by POLITICO’s E&E News and highlighted in a previous story showed the agency was prepared to operate its Joint Polar Satellite System under a "minimum mission operations approach." The directive would have meant the delay of maintenance work such as flight software updates — which former NOAA officials said could ultimately degrade the accuracy of weather forecasts.
But NOAA said Monday it would continue to maintain the satellite network. At issue was whether the agency was going to renew a contract for its upkeep, which it says has been done.
[ Back to Top ]
By Scott Waldman, E&E News by Politico
at https://www.eenews.net/articles/backlog-of-unsigned-contracts-paralyzes-noaa/
May 20, 2025
A growing backlog of hundreds of unsigned NOAA contracts has slowed agency operations to a crawl — so much so that even Sen. Ted Cruz, a staunch ally of the Trump administration, has raised concerns about the gridlock.
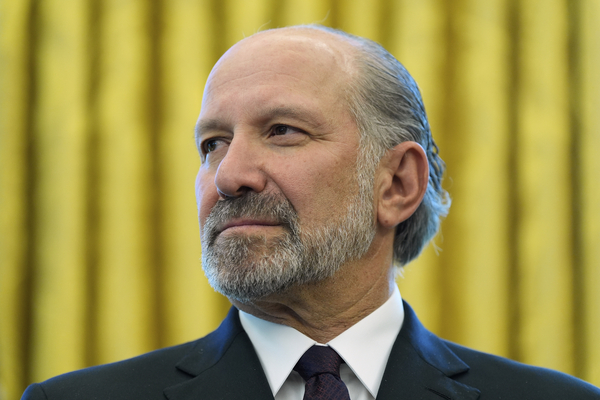
The bottleneck is due largely to one man: Commerce Secretary Howard Lutnick, whose portfolio includes the National Oceanic and Atmospheric Administration. After taking office in February, Lutnick insisted that he personally review any contract in excess of $100,000.
Intended as an attempt to identify waste and redundancy, the policy instead has sown chaos at the nation’s preeminent climate and weather agency, say former and current NOAA officials.
More than 200 NOAA contracts — including one aimed at helping local communities prepare for extreme weather events — are now stuck in limbo, waiting for Lutnick to make a decision. The impasse has forced NOAA to furlough employees, and it has created a work environment where NOAA staffers spend much of their time trying to justify their work — rather than doing it, they say.
[ Back to Top ]


Thanks to Fredric Raab, Licensed Amateur Radio Operator and Adjunct Faculty, College of the Desert, Palm Desert, California
The Teachers Institute (TI-1) is a 4-day professional development workshop where teachers will be introduced to the basics of electronic principles, radio frequency propagation, and antennas. They will gain practical experience building simple electronic circuits and antennas. Additionally, the teachers will participate in a hidden transmitter hunting activity (aka foxhunting).
Additional elective sessions include "Balloons and Amateur Radio," "Space Comm & Radio Astronomy," and "Remote Sensors & Data Gathering."
We provide free equipment, live demos, and hands-on lessons on wireless technology to bring back to your classroom.
[ Back to Top ]
From NOAA News & Features
at https://www.noaa.gov/education/multimedia/video/cooking-up-storm-atmospheric-science-in-your-kitchen
November 22, 2021
Brush up on your meteorology with these tasty, try-this-at-home activities...along with one "maybe-don't-try-this at home!" We're headed to the kitchen to answer your burning questions: What's the dew point of your leftovers? Why do some seasonings appear to defy gravy — uh — gravity? From convection to condensation, these kitchen science demos are sure to give you some food for thought.
Read on to discover...
[ Back to Top ]
By Kat Troche, NASA Explore
at https://science.nasa.gov/solar-system/sun/explore-our-dynamic-sun/
June 16, 2025
from NASA’s Heliophysics Education Activation Team (NASA HEAT) and the Astronomical Society of the Pacific/Night Sky Network
Have you ever wondered about what the Sun is made of? Or why do you get sunburned on even cloudy days? NASA’s new Explore the Sun toolkit brings the wonders of solar science to you, offering answers to these questions and more!
.jpg)
A collaboration between NASA’s Heliophysics Education Activation Team (NASA HEAT) and the Astronomical Society of the Pacific’s Night Sky Network program, this resource was developed for informal educators, amateur astronomers, and astronomy enthusiasts alike, providing engaging activities for anyone eager to learn more about our nearest star.
Whether you're hosting a solar viewing event or an indoor presentation, the Our Dynamic Sun toolkit provides easy-to-use materials designed to spark curiosity. Each card in the set pairs NASA images with clear explanations for each topic:
These cards not only answer common questions the public may have, but also highlight how NASA’s solar research helps us understand space weather, solar storms, and their impacts on our daily lives.
Bring the Sun’s story to your community and inspire the next generation of explorers. You can download this free Our Dynamic Sun toolkit here: https://bit.ly/suntoolkit.
See the original item with lots of links to more information at https://science.nasa.gov/solar-system/sun/explore-our-dynamic-sun/.
[ Back to Top ]
By Hannah H. Ziegler and Jae Ryu, The Science Teacher, Volume 92, 2025
Reported by Taylor & Francis Online
at https://www.tandfonline.com/doi/full/10.1080/00368555.2025.2468336?src=exp-la&utm_medium=email&utm_source=rasa_weekly&utm_campaign=newsletter
May 7, 2025
This pilot initiative explores the design and integration of drone technology in a 9th-grade Earth and Space Science curriculum to enhance student engagement in climate science. In this three-week Drone Climate Project, students built drones using low-cost kits, learned programming via Arduino IDE software, and utilized Tinkercad for the 3D design and printing of drone attachments in small groups. The project encouraged hands-on learning and problem-solving as youth connected STEM principles with real-world climate issues. Facilitated by self-paced instructional materials and collaborative-design processes, students developed meaningful solutions to combat relevant environmental challenges. Overall, this work serves as a model for integrating drones into diverse educational settings and demonstrates the potential of drones as instructional tools in promoting climate education. Thus, we invite other educators to adapt and implement drone-based curricula in their own educational contexts.
[ Back to Top ]


How's the weather today? Is it the same as yesterday? Is it the same where your friend lives in a distant city? Will it be different tomorrow?
In this lesson, learners describe weather all over the world. After exploring causes of weather patterns, they will describe how weather in one location helps predict the weather in related areas.
Teams of learners study, chart, and write about the weather and its effects on a particular city, for a month. The team constructs a multimedia presentation of its findings. The class constructs a final project that uses and merges the teams' findings to demonstrate weather patterns around the world.
| Grade Level: | 3-5 |
| Time Requirement: | 2-3 class periods |
| Prerequisites: | None |
| Relevant Disciplines: | Life Science, Earth & Space Science, Geography |
[ Back to Top ]
Share your satellite-based lesson ideas with the teaching community.
Send us a complete lesson plan, or simply suggest a lesson idea. If you found the idea online, please share the source as well. The lesson can be about anything that helps connect learners with satellite-based technology - any grade level K-12 - any STEM subject area including geography.
Satellite-technology includes any part of the science, math, engineering, or technology of satellites, rockets, and remote sensing instruments as well as the use of any environmental satellite data to explore questions related to aspects of global change and local impacts in the long term, short term, and catastrophic time frames. Of special interest are lessons providing opportunities for learners to inquire, experiment, and apply mathematics.
Perhaps you designed a lesson yourself - we will happily prepare it for future publication in More Lessons from the Sky and inclusion in the SEA's online Lesson Plan Library with full credit to the originating author(s). Perhaps you found a worthy lesson plan published elsewhere - we will do the research for possible inclusion in a lesson plan spotlight. In either case, you will receive full credit for developing and/or bringing the lesson to the attention of the teaching community. Don't forget to share your insights if you tried the lesson with students.
Please share your ideas at SEA.Librarian@SatEd.org.
[ Back to Top ]

![]()

This edition of the SEA Newsletter was produced in HTML5.
It is best viewed with most recent updates of Firefox, Edge, Chrome, Opera, or Safari.
©Satellite Educators Association, Inc. (SEA) https://SatEd.org SEA.Newsletter@SatEd.org
Satellite Educators Association, Inc. is a 501(c)(3) non-profit educational organization to shich donations are tax deductible.
The SEA Newsletter is published quarterly in March, June, September, and December.
The SEA Newsletter is published on-line and available at no cost.
SEA terms, conditions, policies, and contact information are detailed HERE.
Unless otherwise listed, all photo and image credits are the authors of the articles.
Any opinons expressed in this Newsletter are those of the authors
and not necessarily those of the Satellite Educators Association, Inc.
or any of its officers, members, or representatives.
Many SEA Newsletter items contain third-party links to sites not governed by Satellite
Educators Association, Inc. The viewer is cautioned to be aware of the terms of use and
privacy policies for those third-party sites.
![]()